

Web Interface Introduction
This page helps you get to grips with the overall layout of the web interface in five minutes: the top bar, the Side Bar, and the Home dashboard you see after logging in.
⚠️ Notes
- The screenshots in this manual correspond to a specific Portal version; the actual interface may have moved on since — always go by what you see on screen.
- Which menus and settings you see depends on your role, your device model and your region — not every account sees the same options.
- Changes you make here are pushed to the device and take effect in real time, affecting the owner's day-to-day operation and Profit — confirm the operating conditions before changing anything significant, and for anything major it is best to speak with the owner first.
- Grid-connection and protection-related parameters (e.g. Work Mode, Storm Guard, Feed/Buy power, and other items under System Settings) should only be changed by someone who understands the electrical implications — an incorrect setting can cause the inverter to disconnect from the grid or fail to meet local grid requirements, reducing energy generation.
Overall Layout
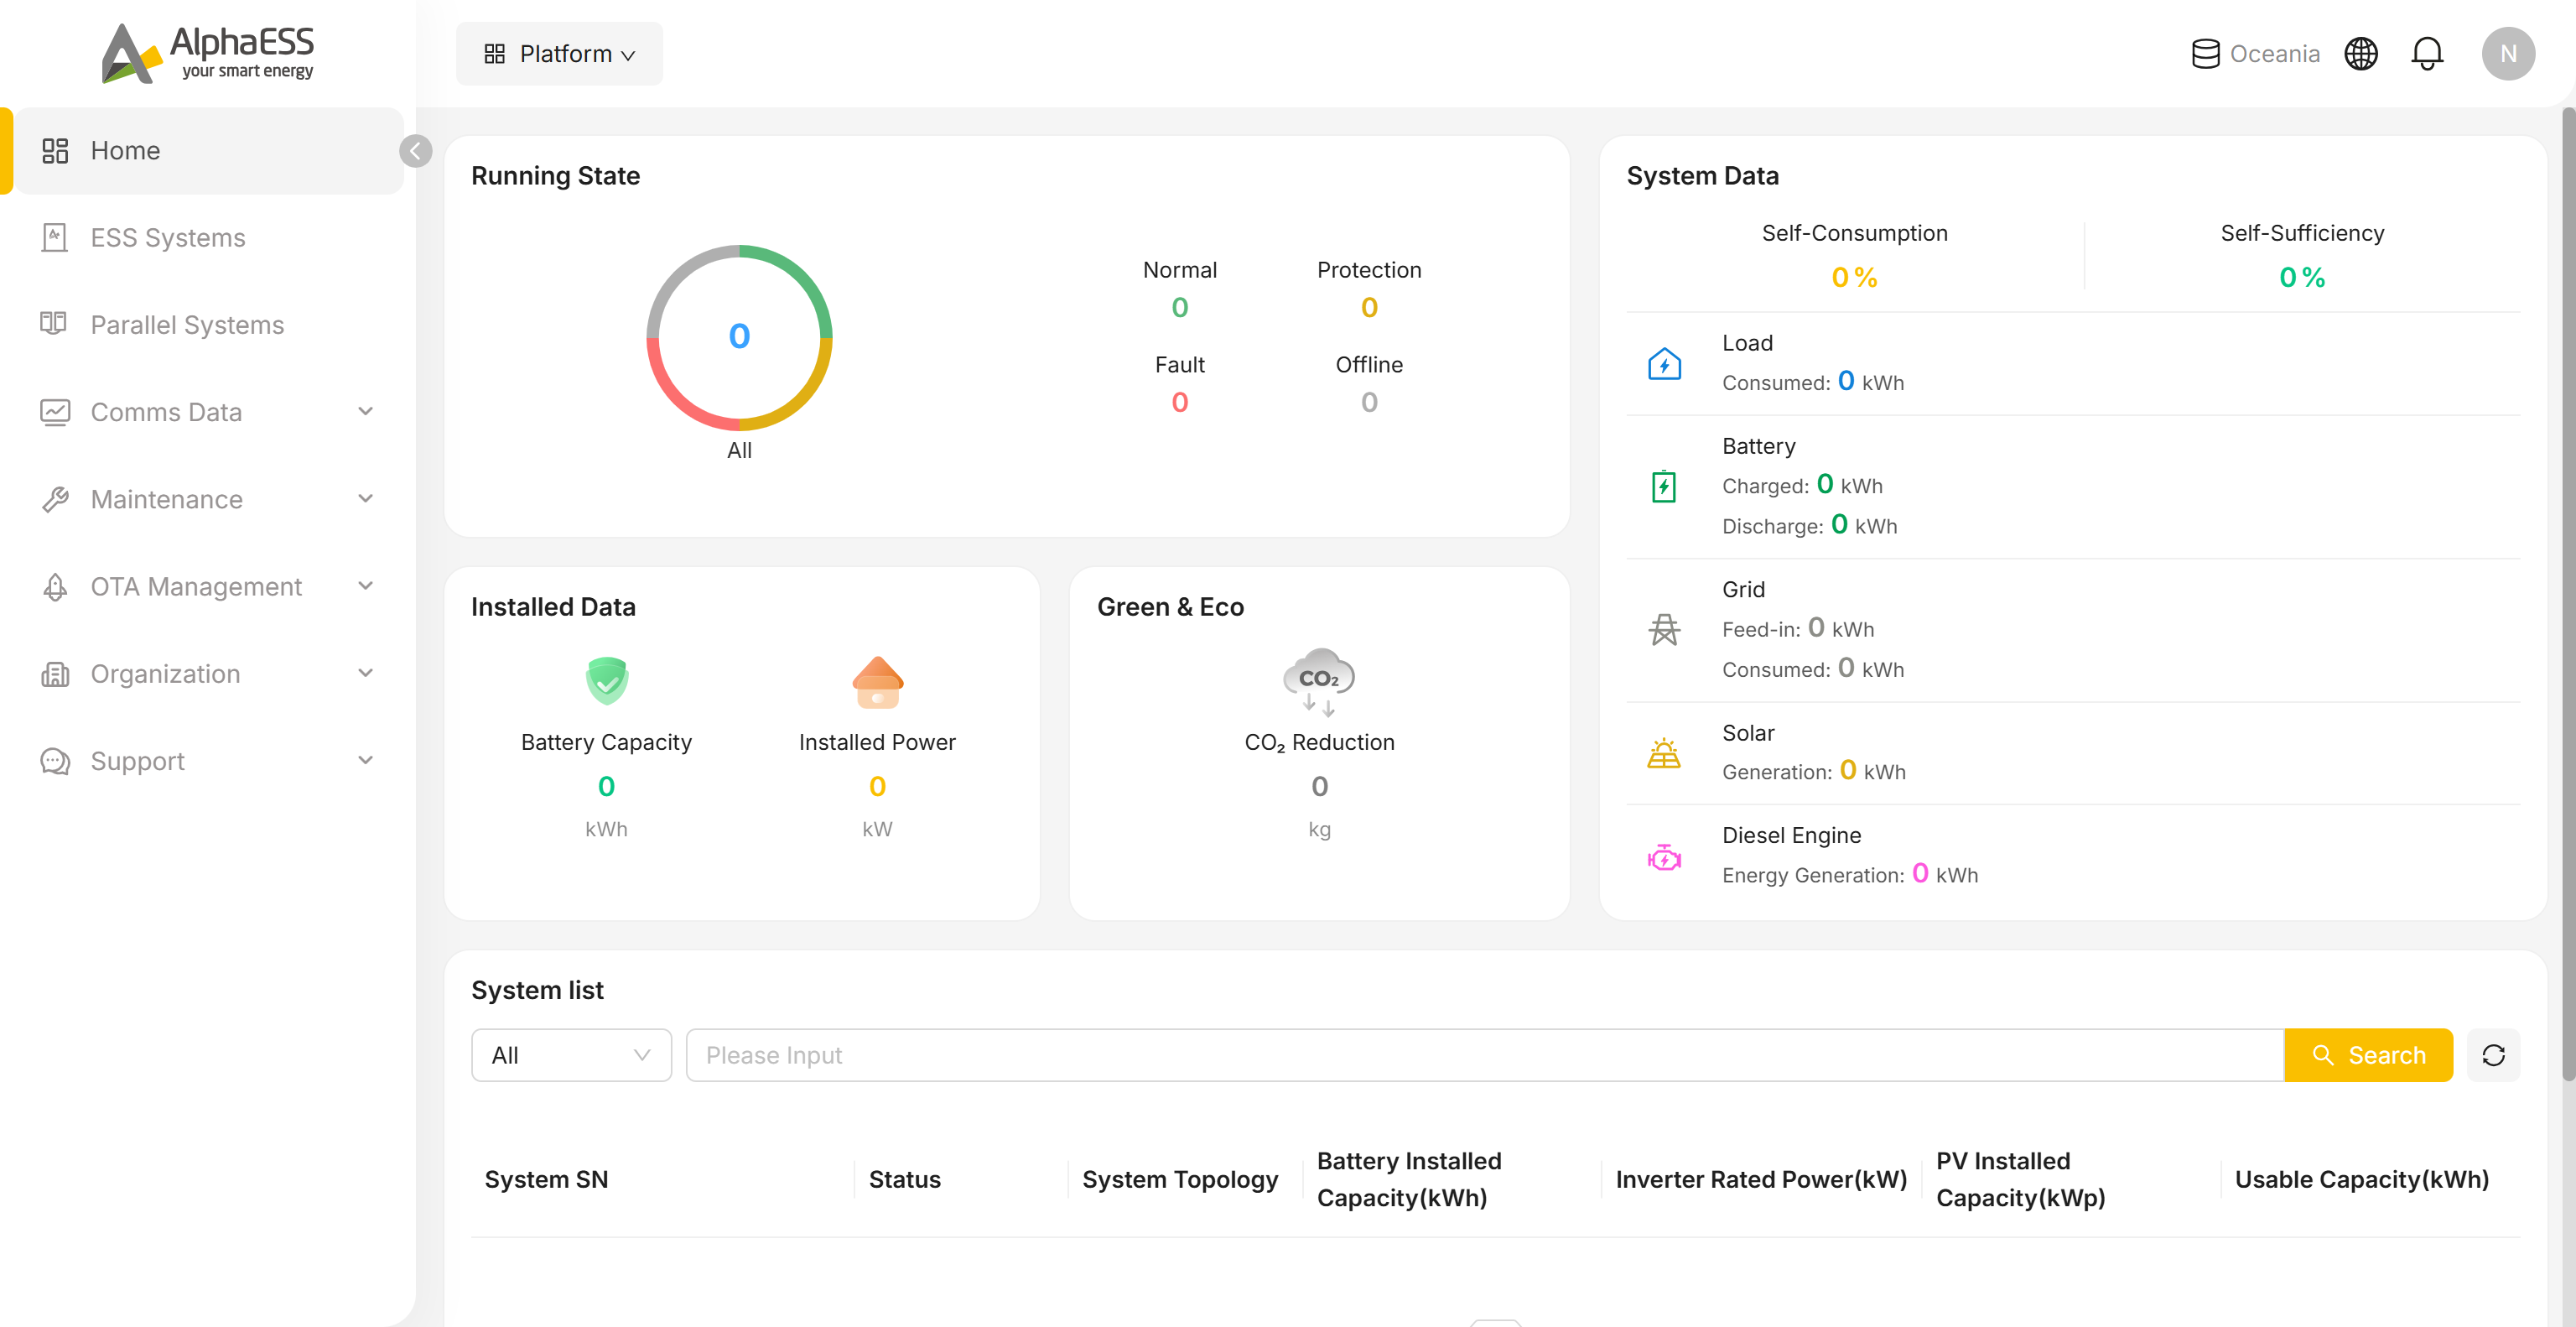
Top Bar
| Element | Description |
|---|---|
| Platform switcher (top left) | Click to open a list of the other platforms your account can access. Each entry is a separate website that opens in a new tab — for example C & I Systems (https://cni.alphaess.com) |
| Server region (e.g. Oceania) | The regional server on which your data is currently held |
| 🌐 Language | Switch the interface language. Available options: Chinese (中文), English, German (Deutsch), Italian (Italiano), Dutch (Nederlands), Spanish (Español), Greek (Ελληνικά), French (Français), Polish (Polski), Czech (Čeština), Swedish (Svenska) |
| 🔔 Notifications | System messages and alarm notifications |
| Avatar | Click to open the account menu: switch organisation/role, add another account, open your profile, or log out — see Avatar Menu below |
Side Bar
| Top-level menu | Sub-menu | Purpose |
|---|---|---|
| Home | — | Organisation operations dashboard (see Home Dashboard below) |
| ESS Systems | — | List, search and details for every energy storage system under your account (3.1 Daily Monitoring) |
| Parallel Systems | — | Setting up and managing parallel systems (one master with multiple slaves) |
| Comms Data | Data Export | Communication data export (4.1) |
| Maintenance | Instruction Management / Breakpoint Resume / Installation Records / System Fault Lookup / Install New System / EV Chargers / Data Migration / System Information Summary / Link System / NMI Registry | Installation and maintenance workflows (Chapters 2 and 3); NMI Registry is covered on 4.2 |
| OTA Management | — | Firmware / software update management for devices |
| Organization | Overview / Members | Organisation and members overview (1.3) |
| Support | Product Resources / Complaints | Product resources and tickets (Complaints takes you to the Online Service Center) — see 4.1 Support |
💡 Tip: The menus vary depending on your role and regional configuration, so always go by what you actually see on screen.
Home Dashboard
After logging in you land on Home by default, which answers three questions: Is everything running as it should? How much has been installed? How much energy has been generated?
Running State
The ring chart breaks down all the systems under your account by status:
| Status | Meaning |
|---|---|
| Normal | Running normally |
| Protection | Protection state (protection logic has been triggered and some functions are suspended) |
| Fault | Fault (needs your attention and action — see 3.3 Maintenance and Troubleshooting) |
| Offline | Offline (communication lost) |
Click a status to jump to the system list filtered by it.
System Data
Cumulative energy data for every system under the organisation:
- Self-consumption rate (Self-Consumption), self-sufficiency rate (Self-Sufficiency), and cumulative energy for Load, Battery, Grid, Solar and Diesel Engine
Installed Data / Green & Eco
- Battery Capacity: total installed battery capacity
- Installed Power: total installed power
- CO₂ Reduction: total CO₂ savings
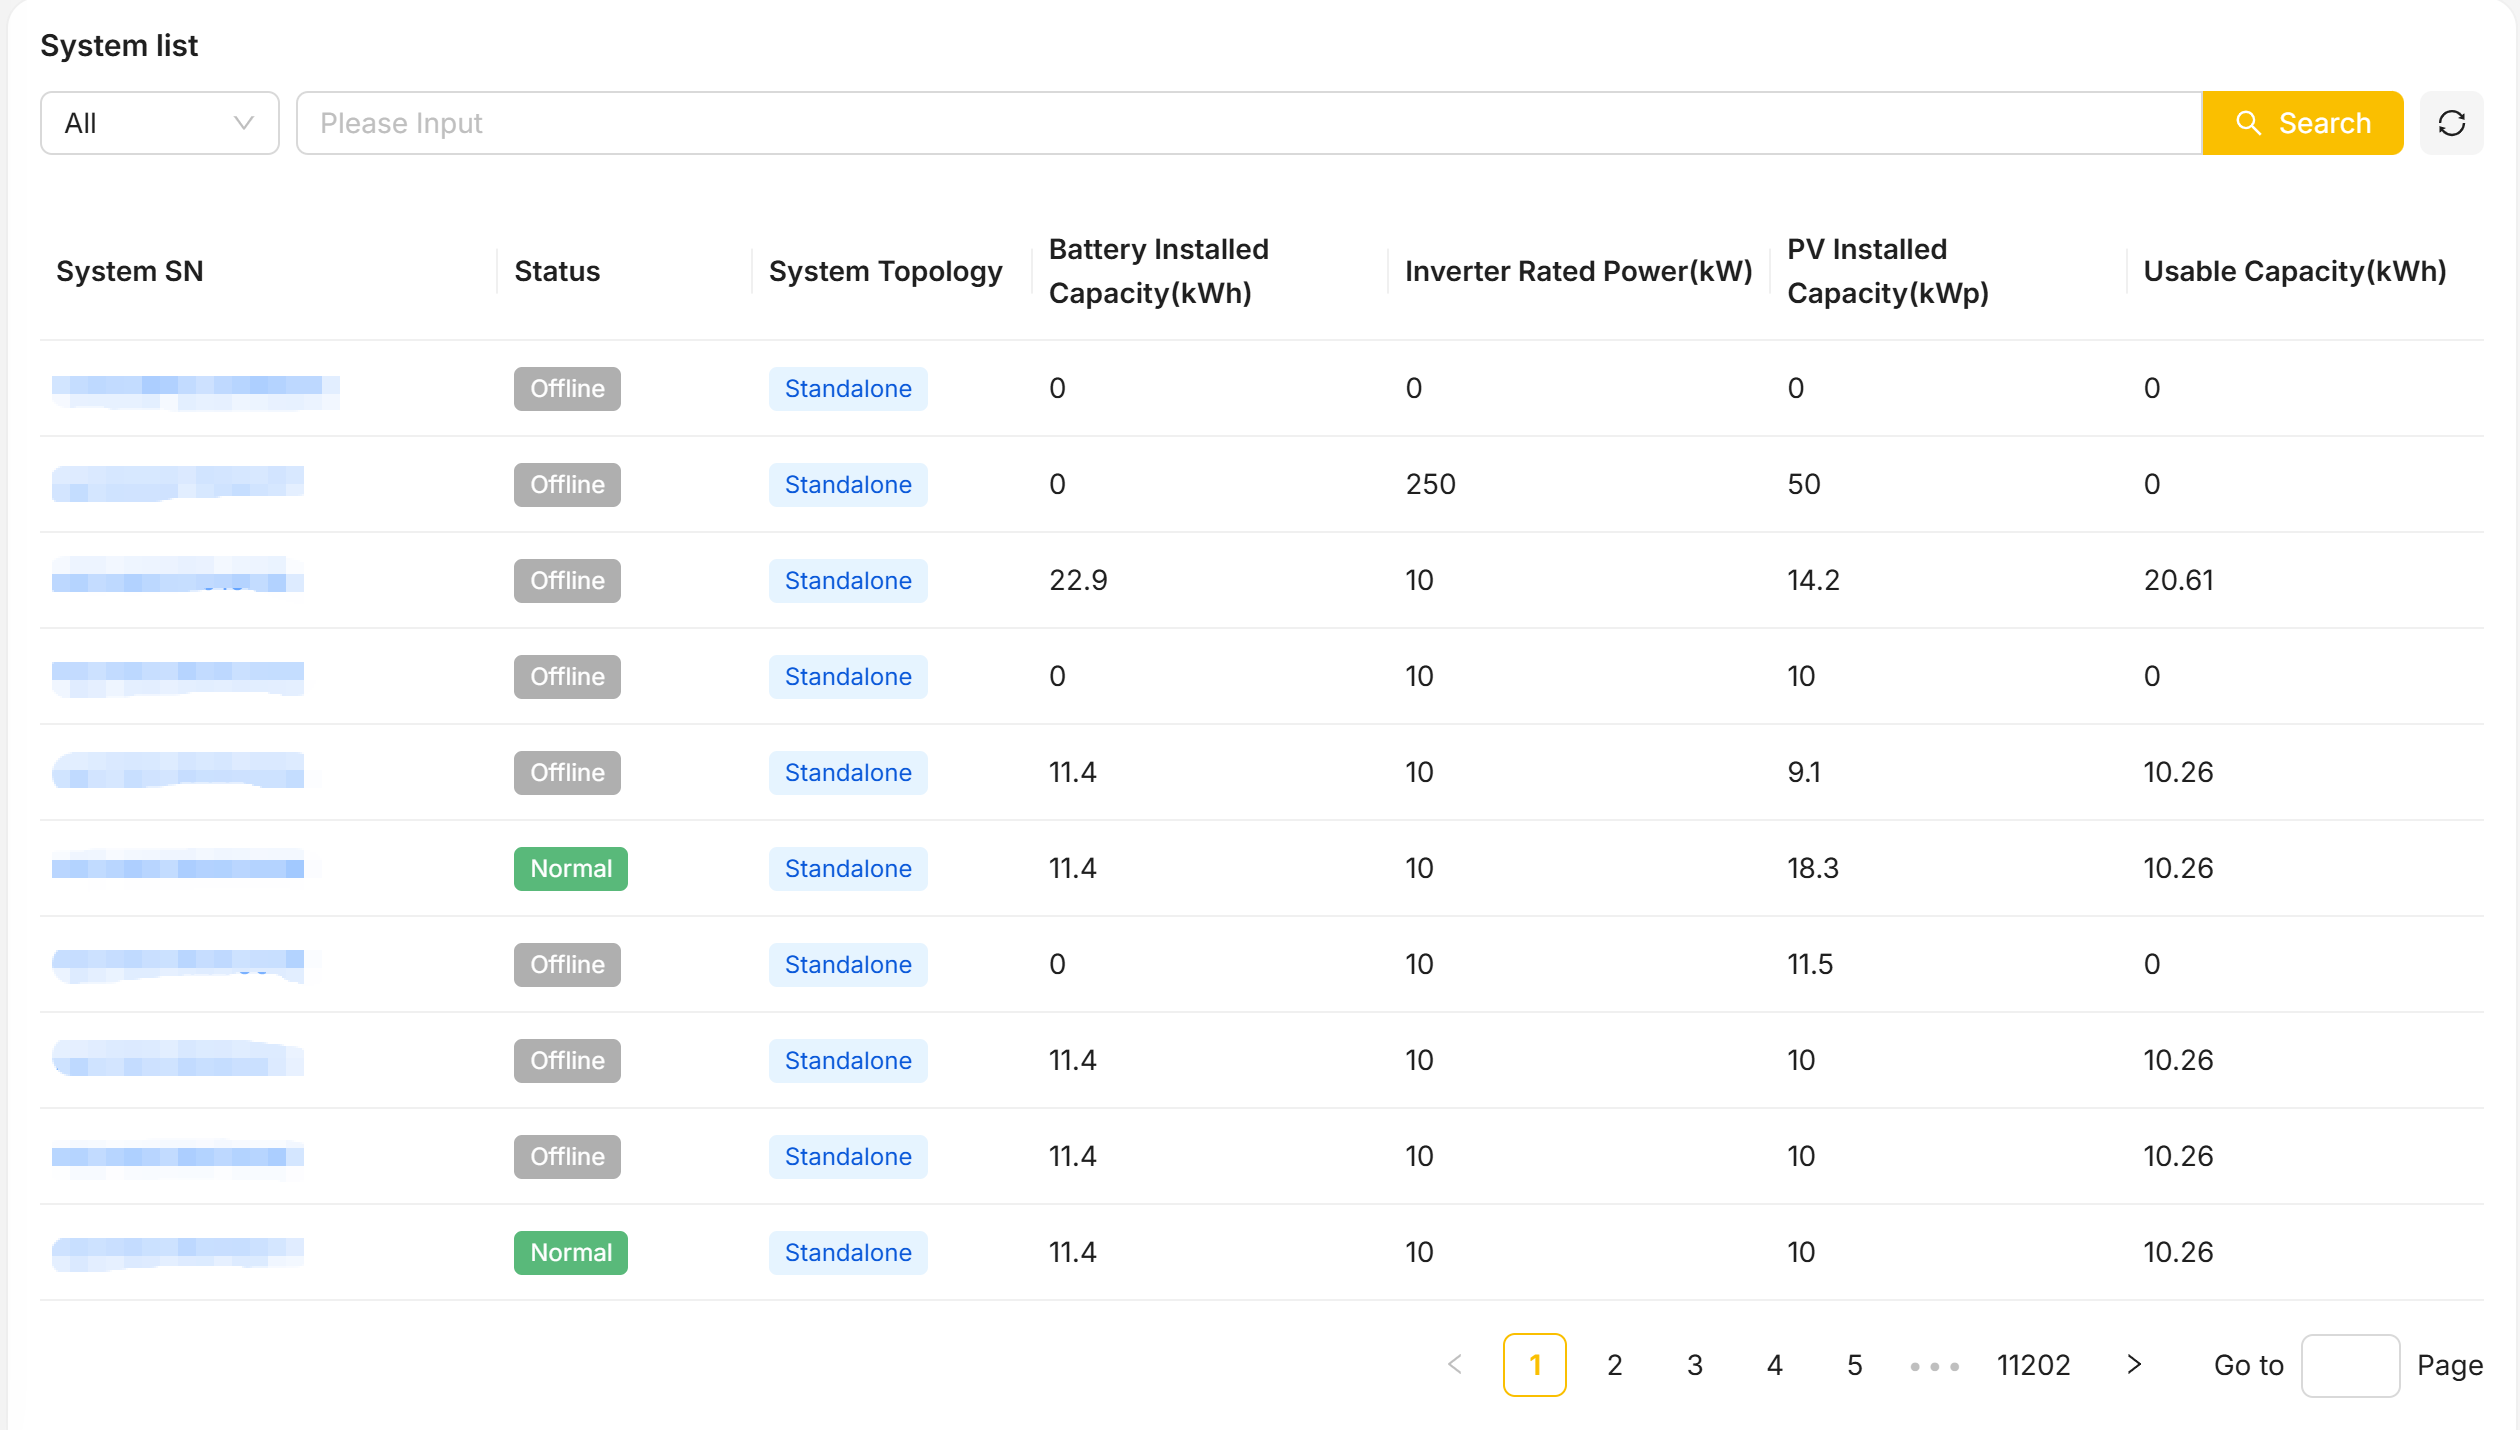
System list
Below the dashboard is a simplified system list with a quick search:
- SN, status, operating mode, battery / inverter / PV installed capacity, available capacity
For the full set of features, use ESS Systems in the Side Bar.
Avatar Menu
Click the avatar in the top right to expand the account menu:
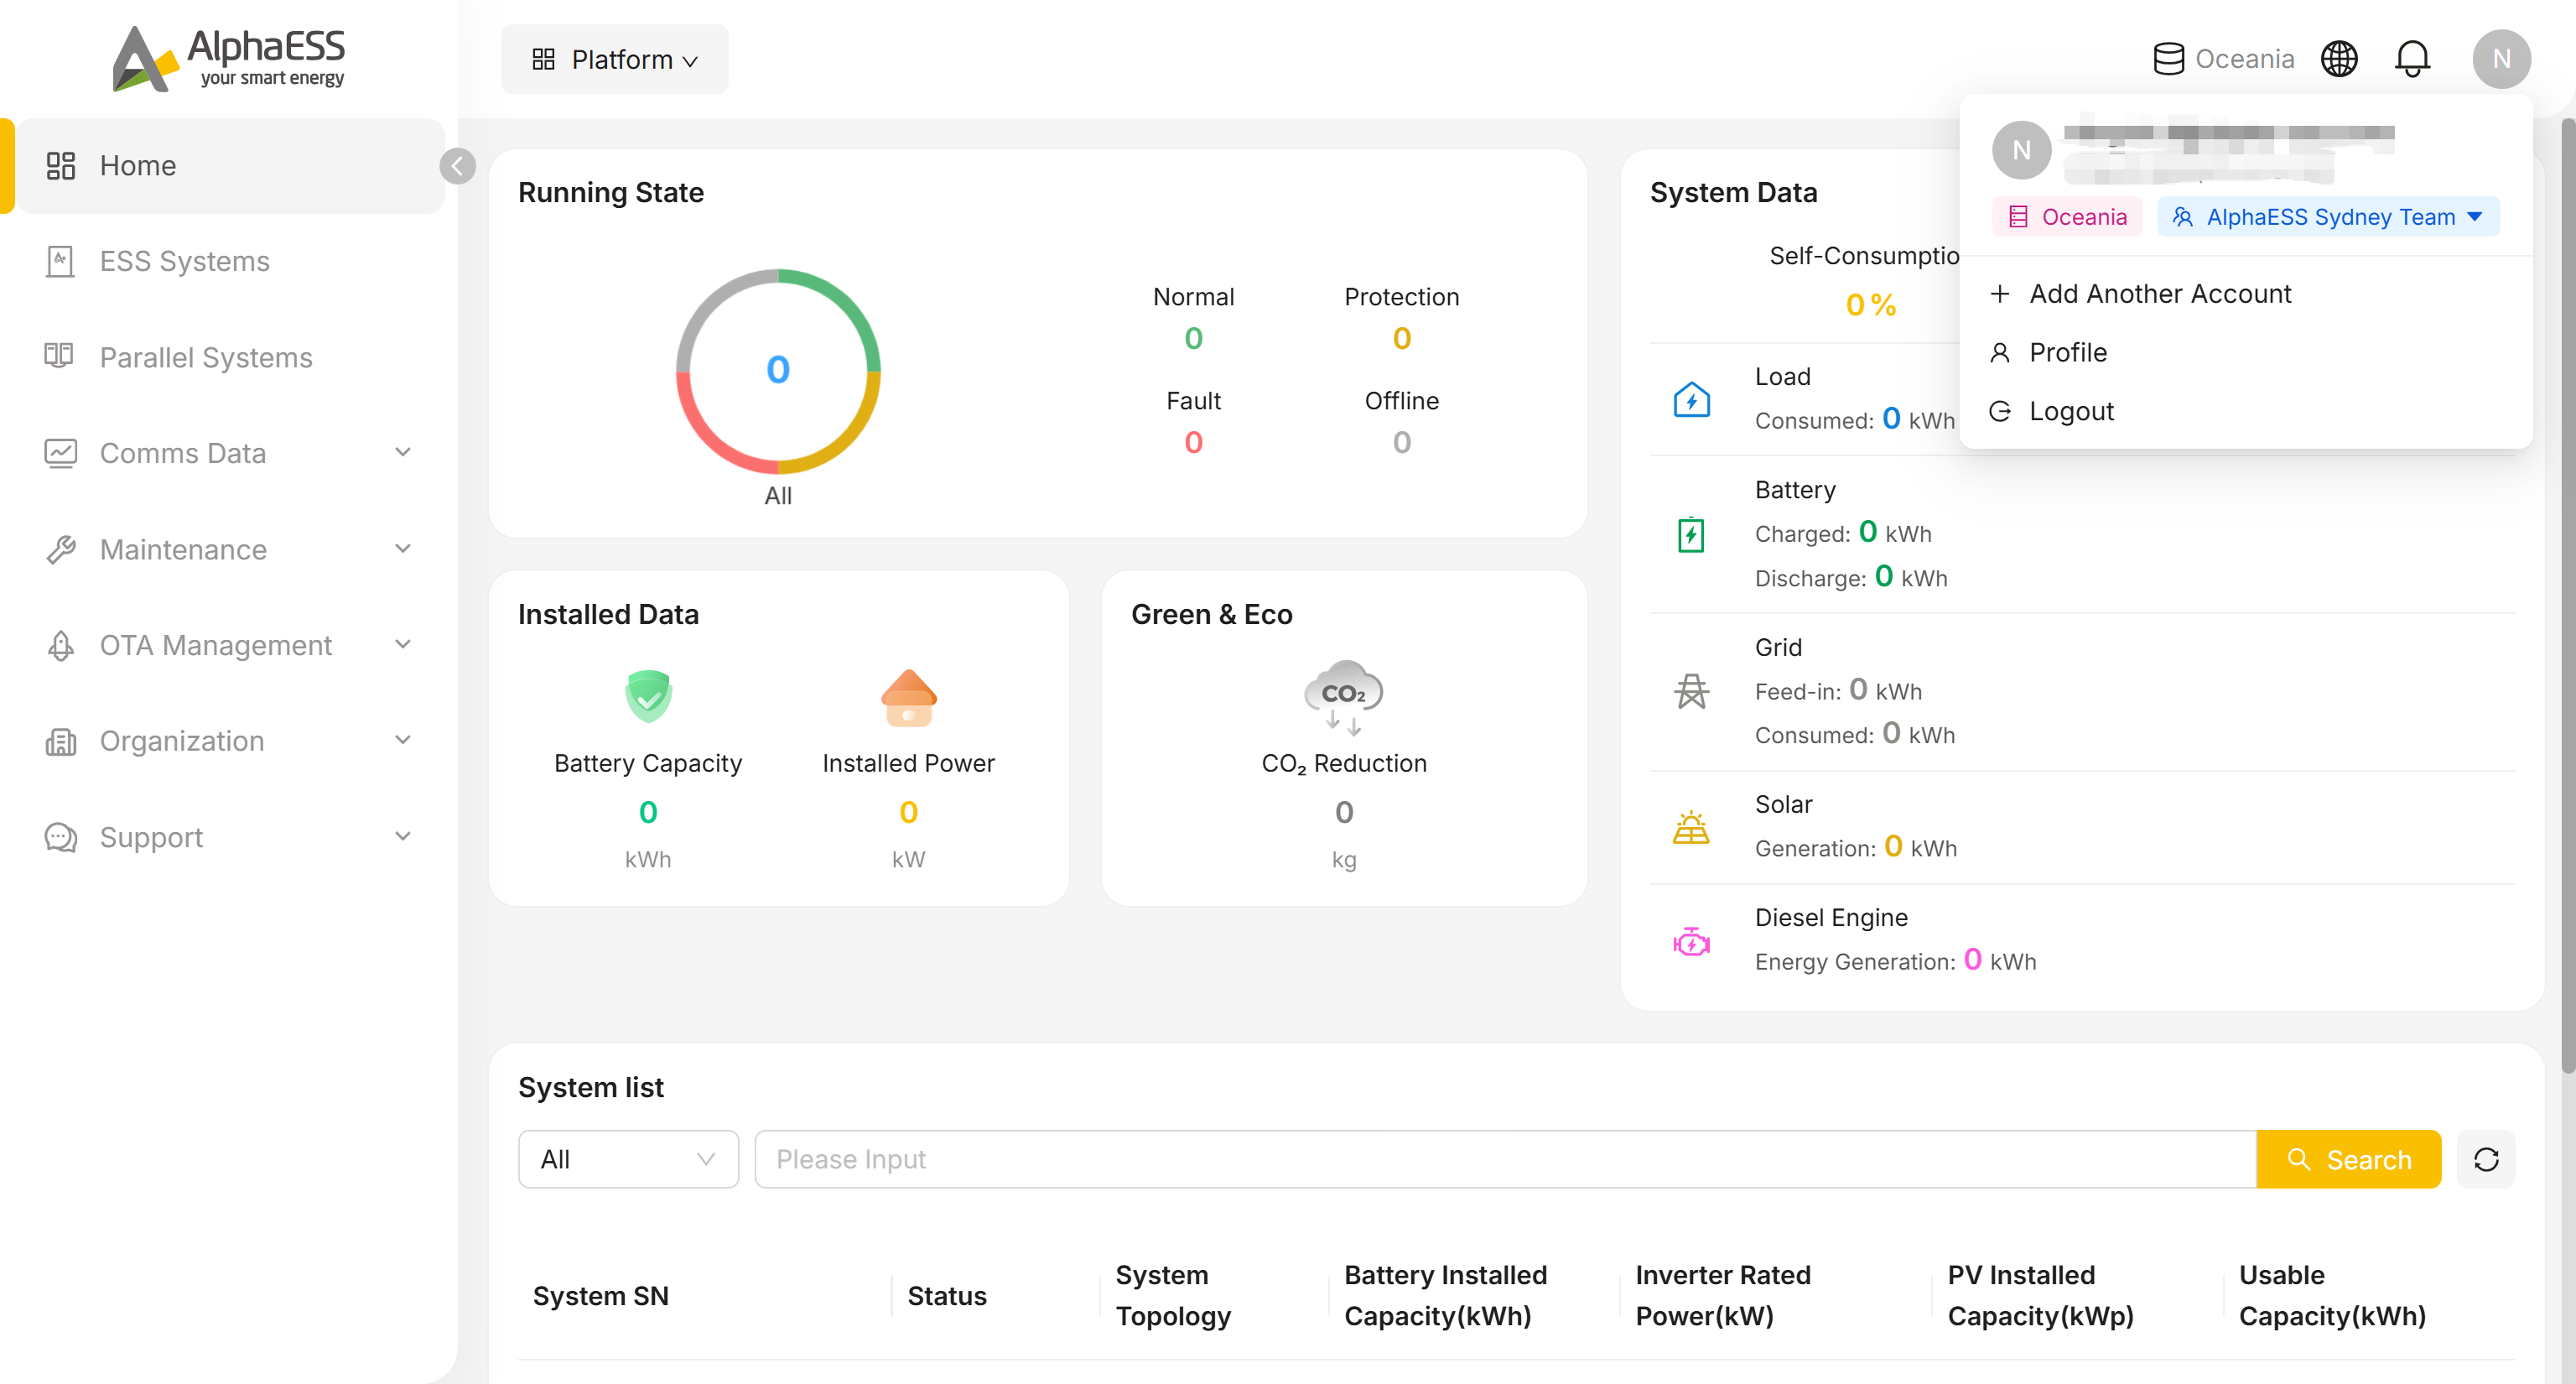
Account header: shows your display name and email address, plus two chips — the current server region (e.g. Oceania) and your current organisation / role (e.g. "AlphaESS Sydney Team ▾").
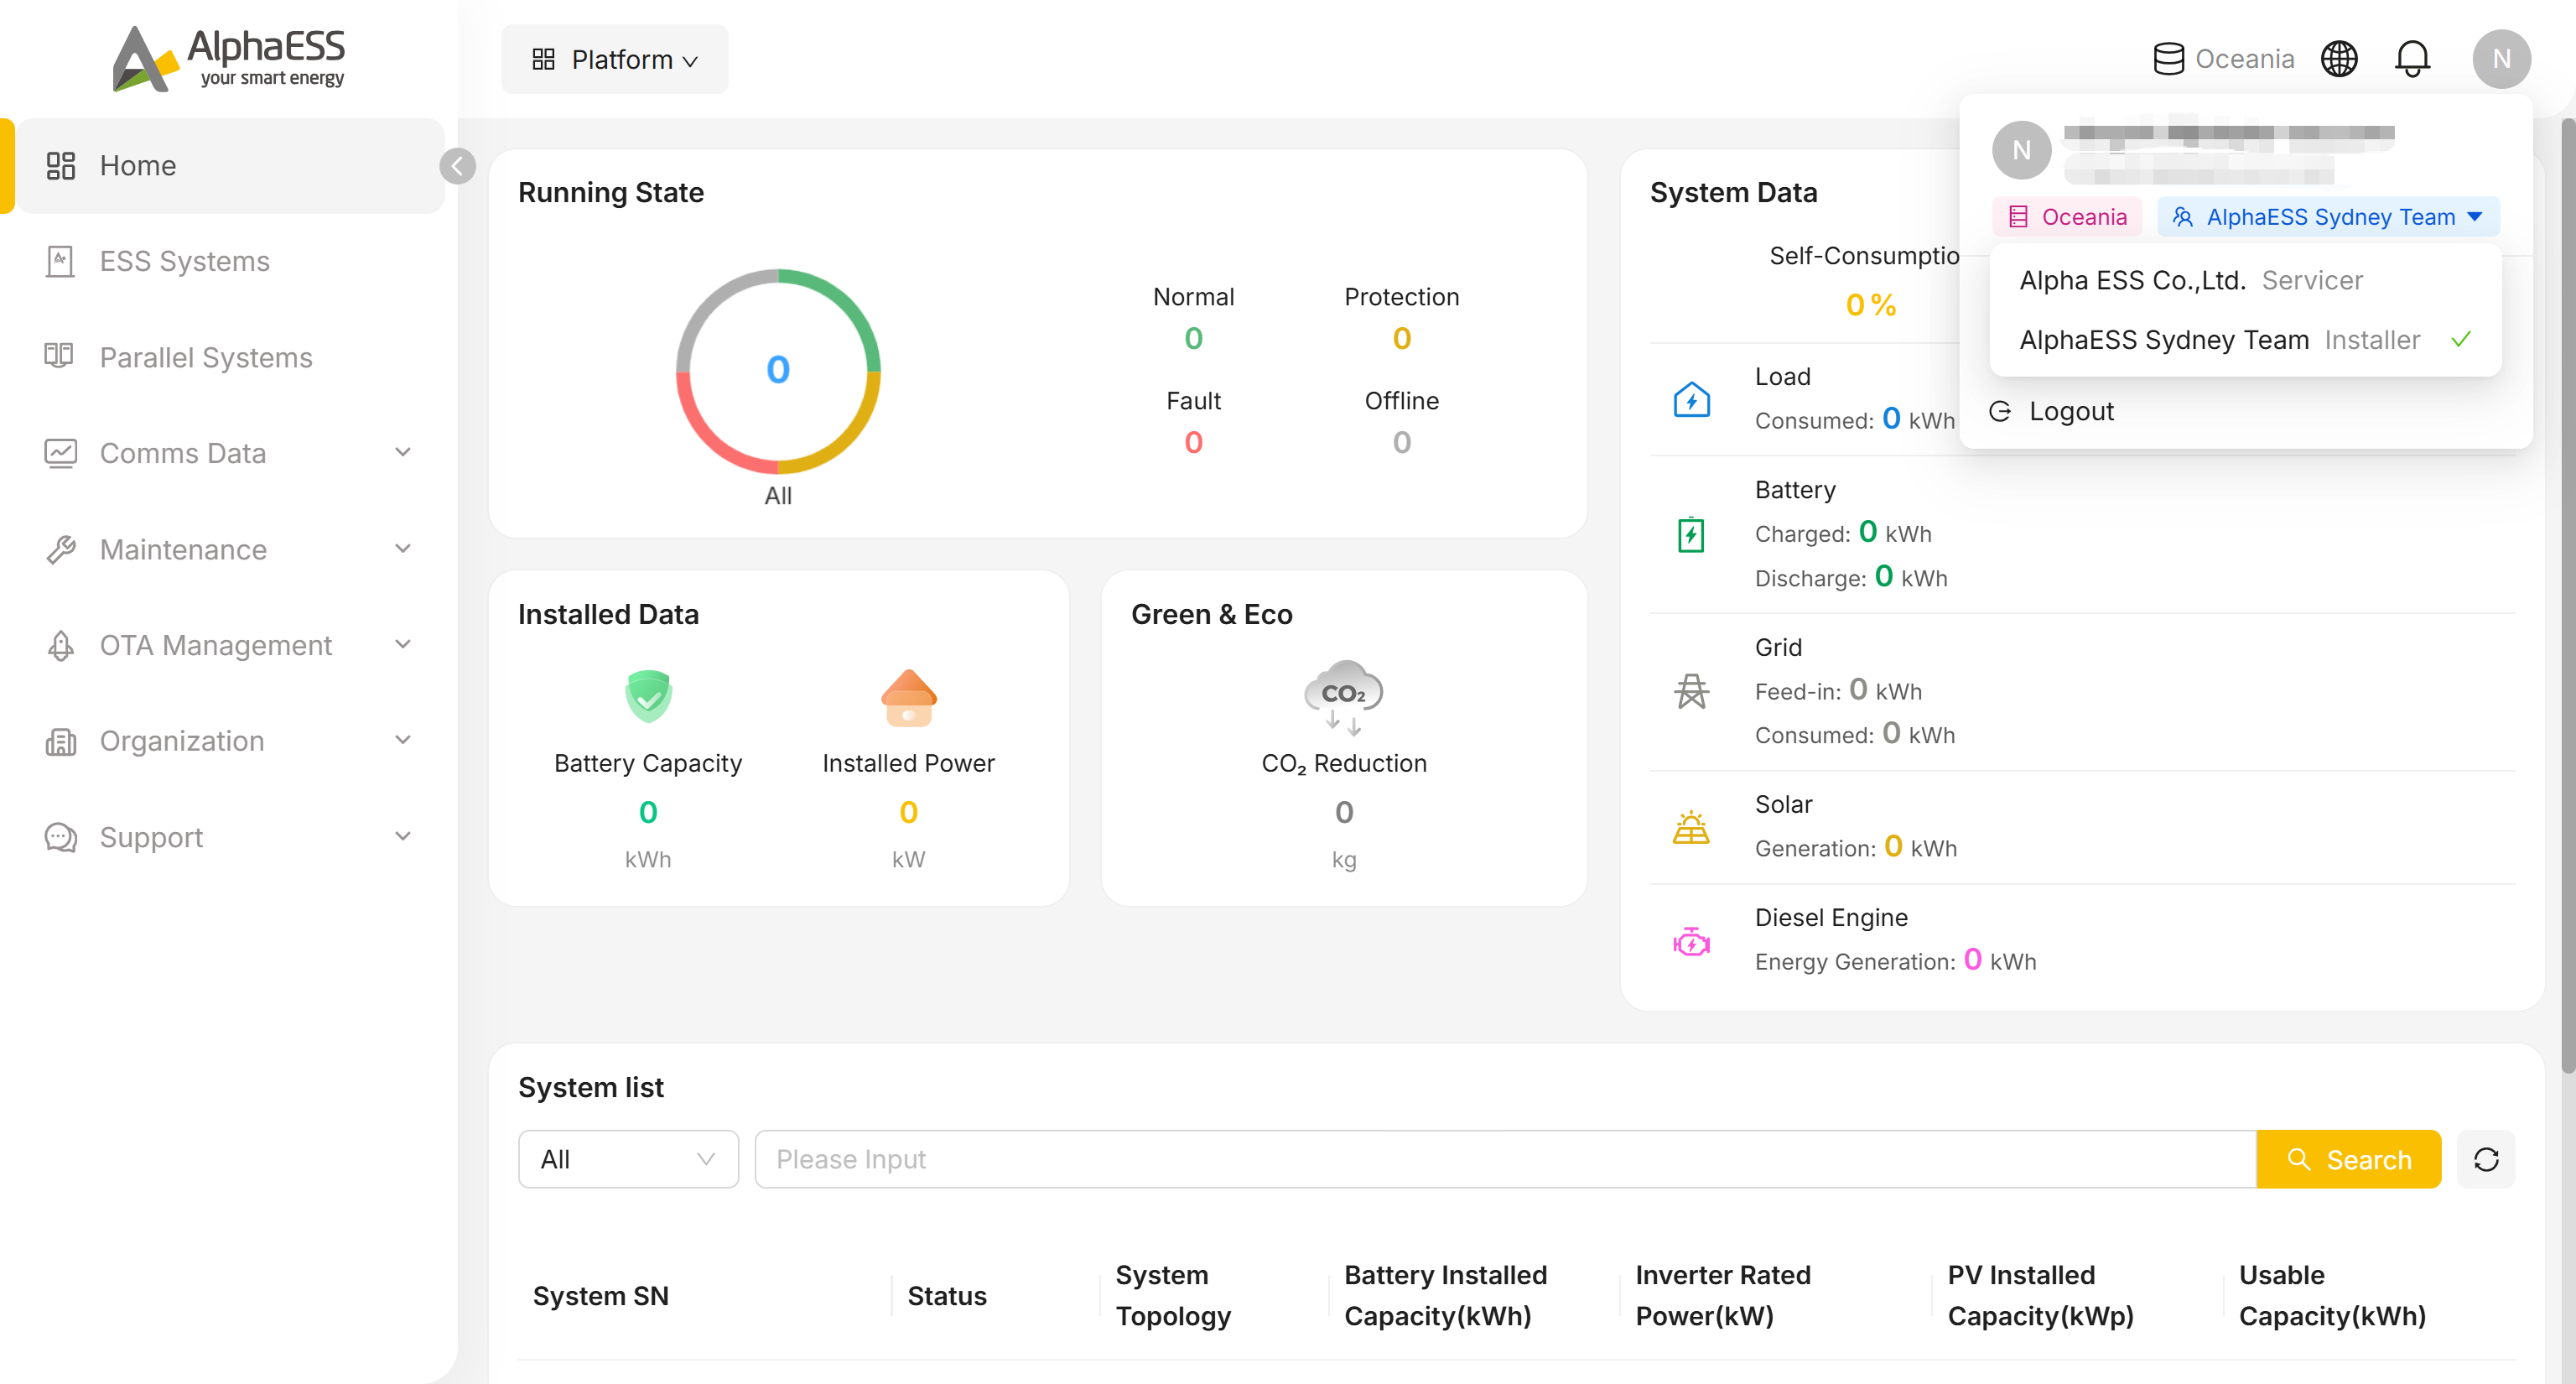
Click the organisation/role chip to expand the full list of organisations you belong to, each labelled with your role there (e.g. Servicer, Installer). Click an entry to switch your active organisation and role; a checkmark marks the one currently in use.
Add Another Account: sign in with another account without logging out of the current one, so you can switch between accounts.
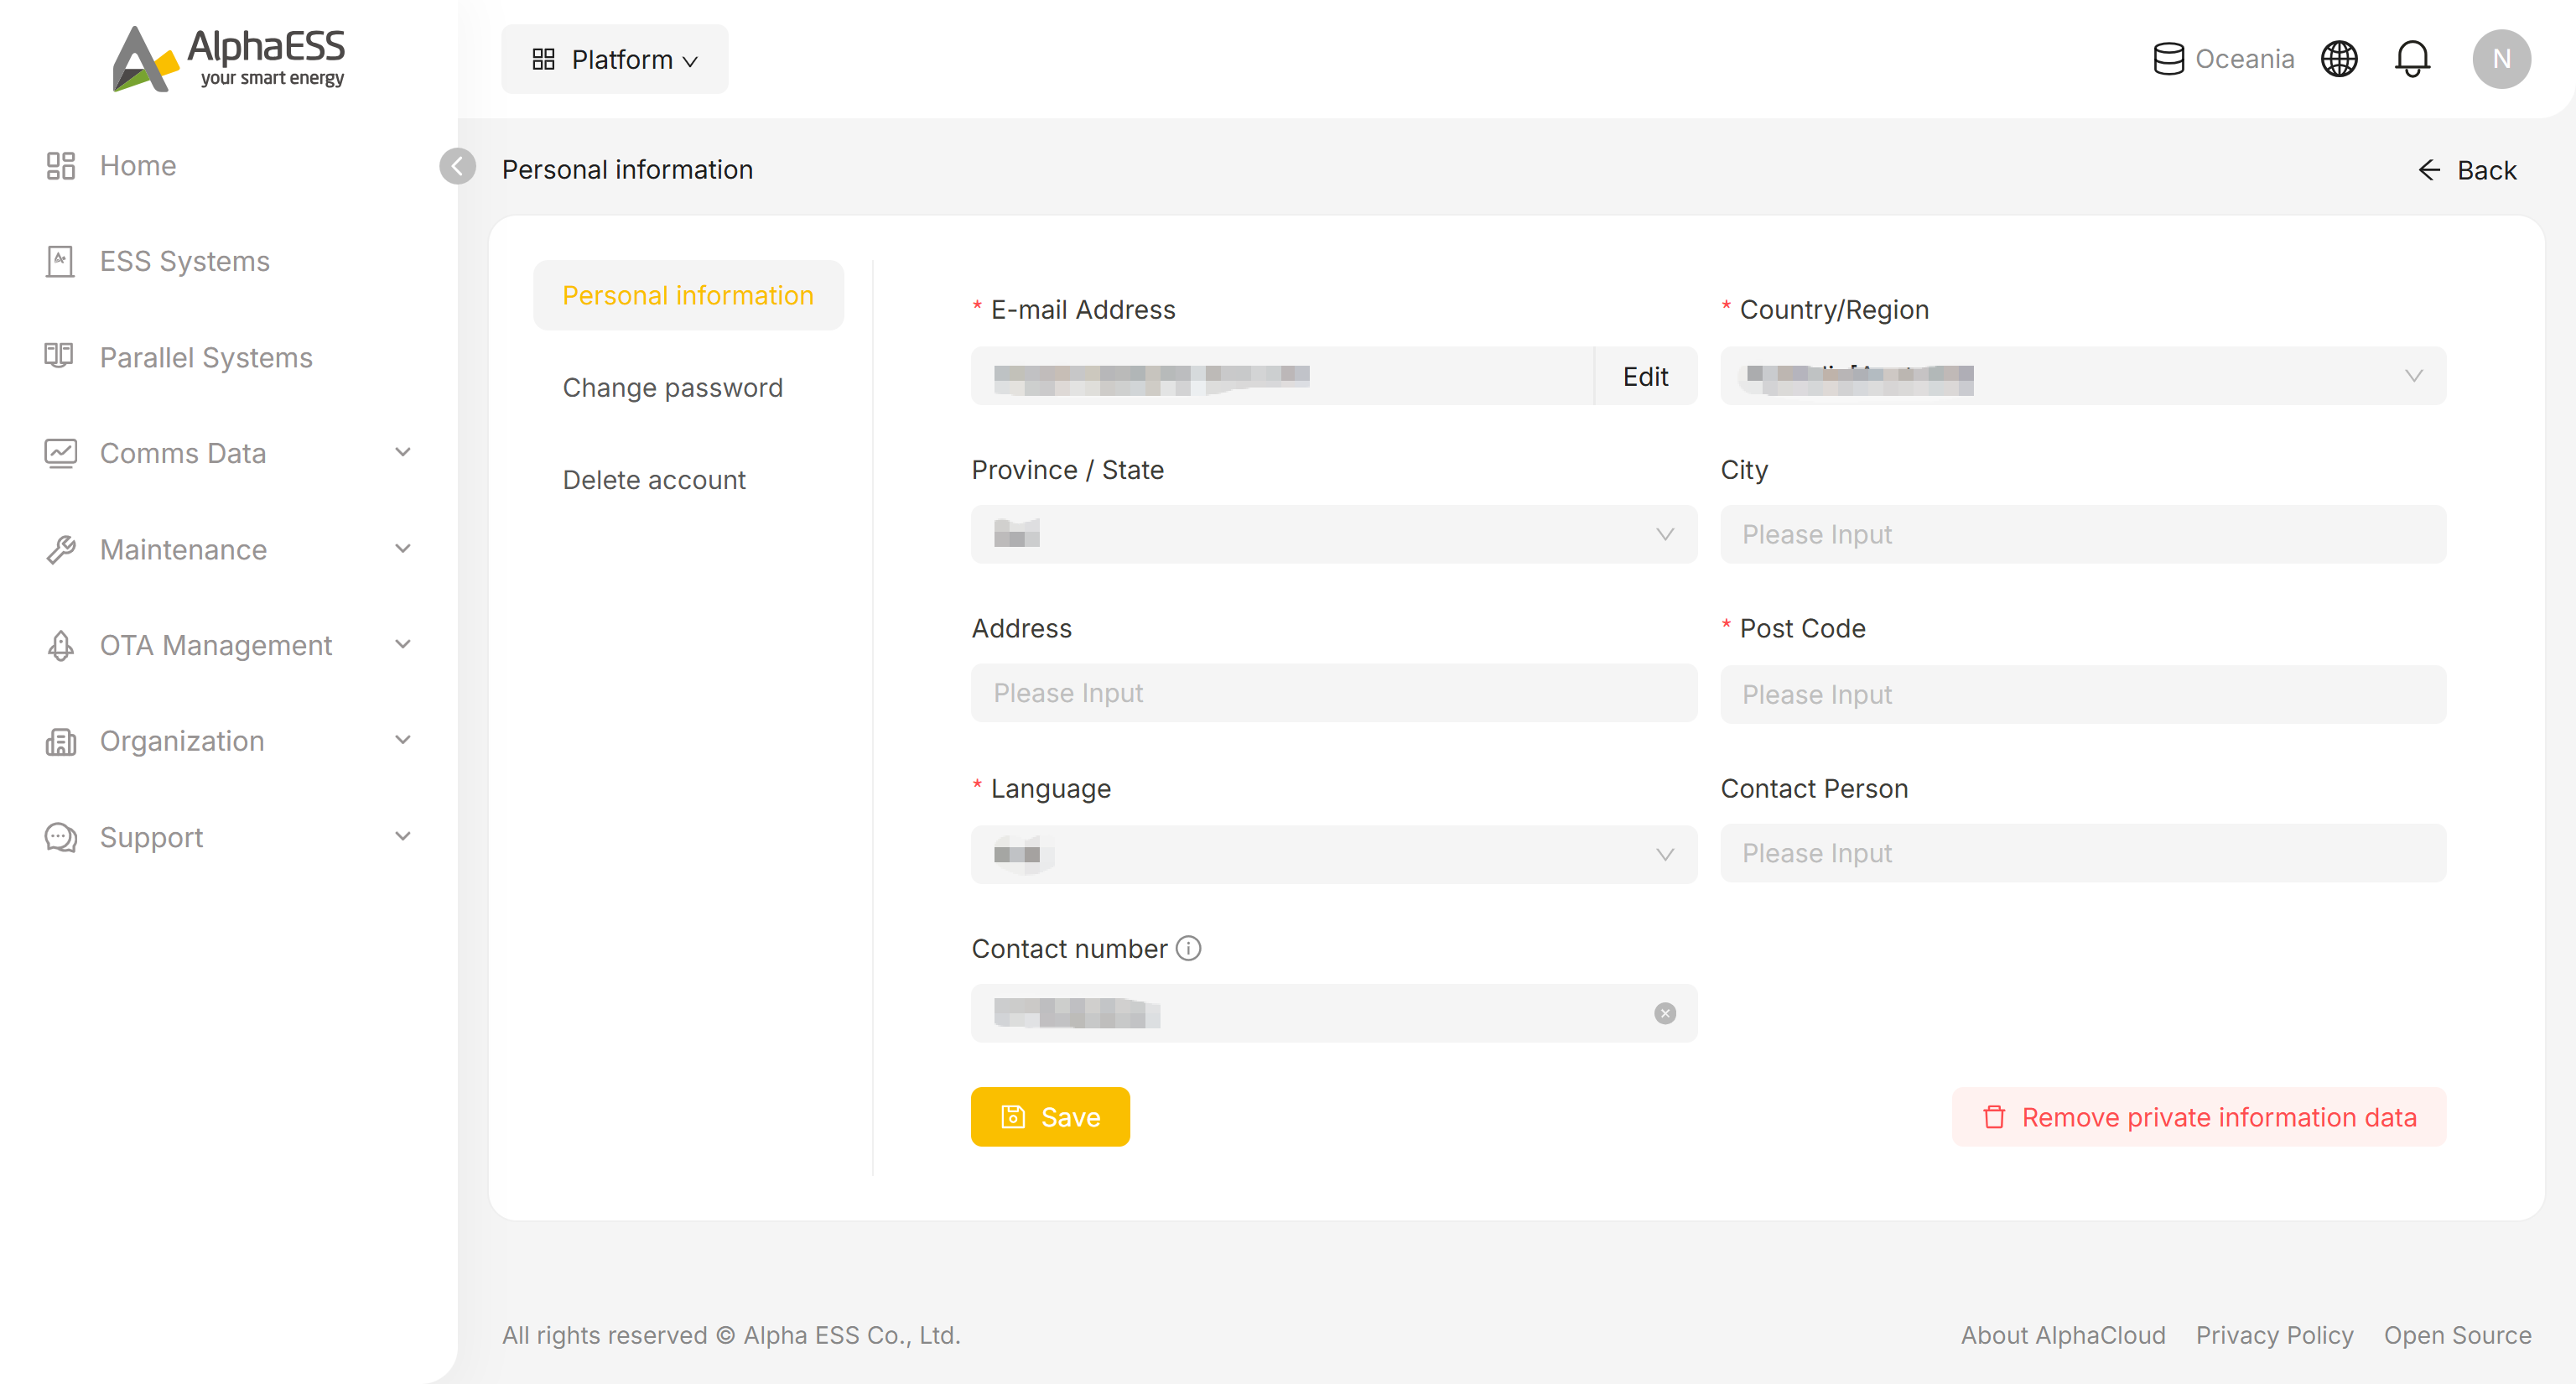
Profile: opens the personal information page, which has three tabs:
Personal information — edit the fields below, then click Save:
- Email address, country/region, province/state, city, address, post code, interface language, contact person, contact number
A Remove private information data button is also available here.
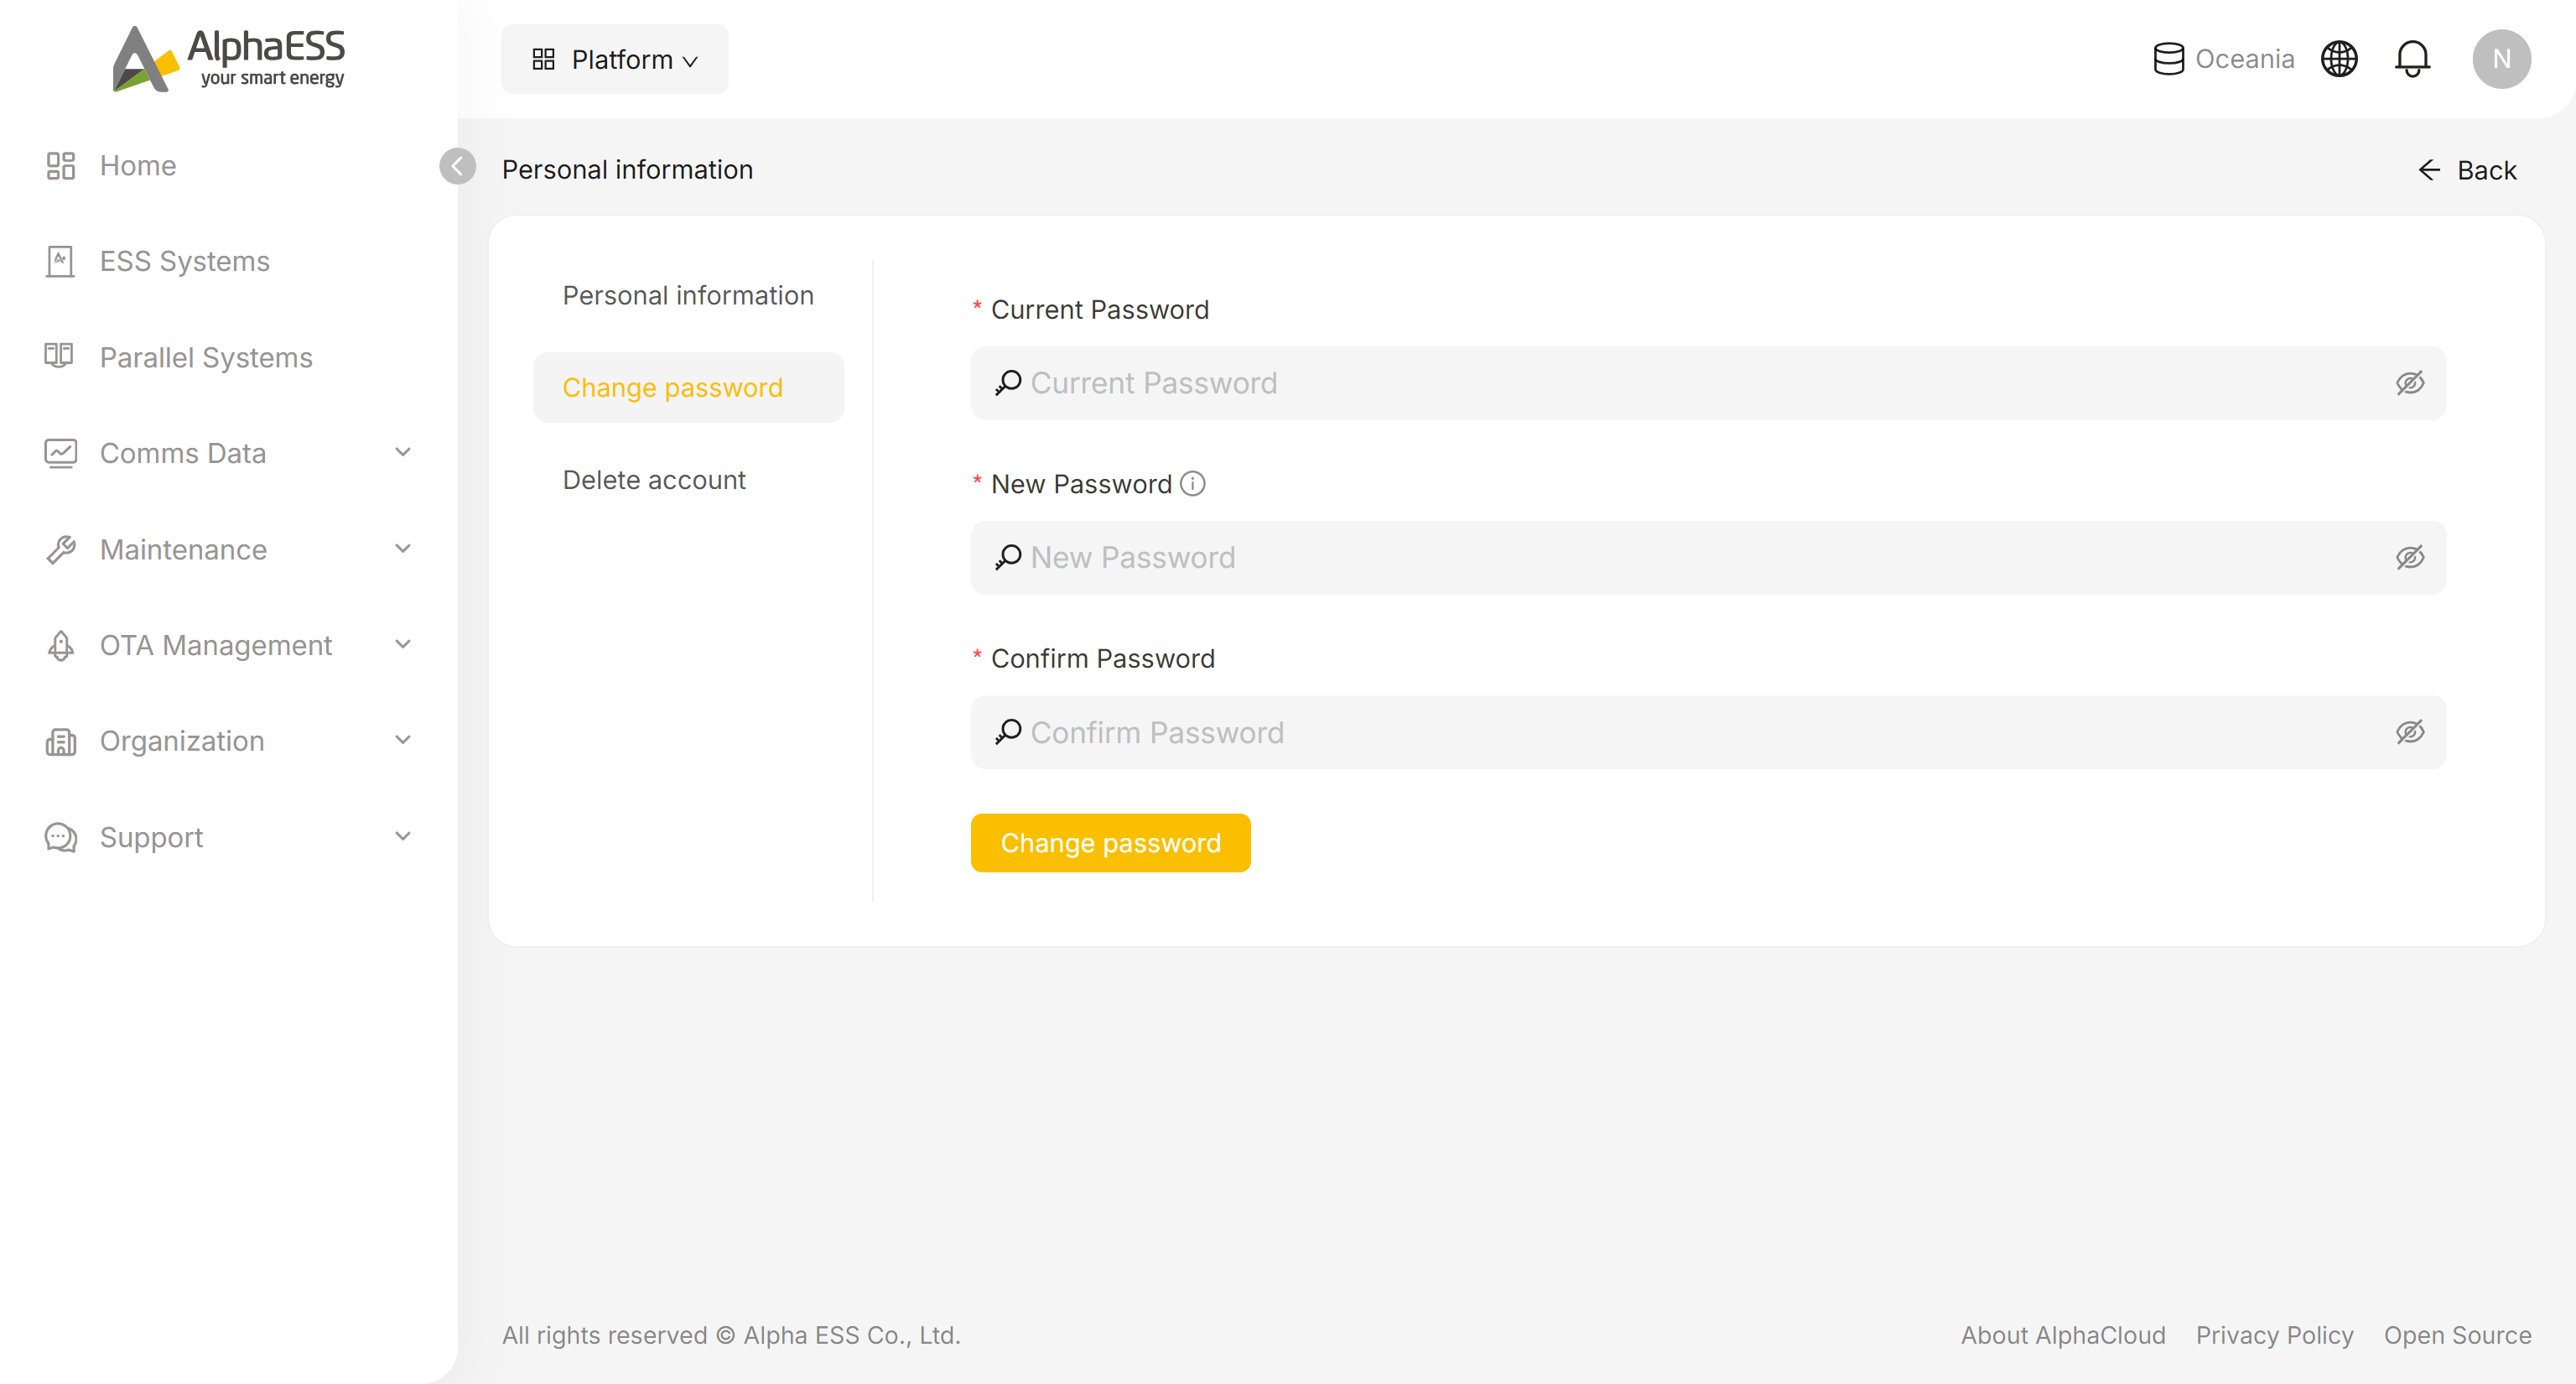
Change password — change your login password by entering your current password and a new one.
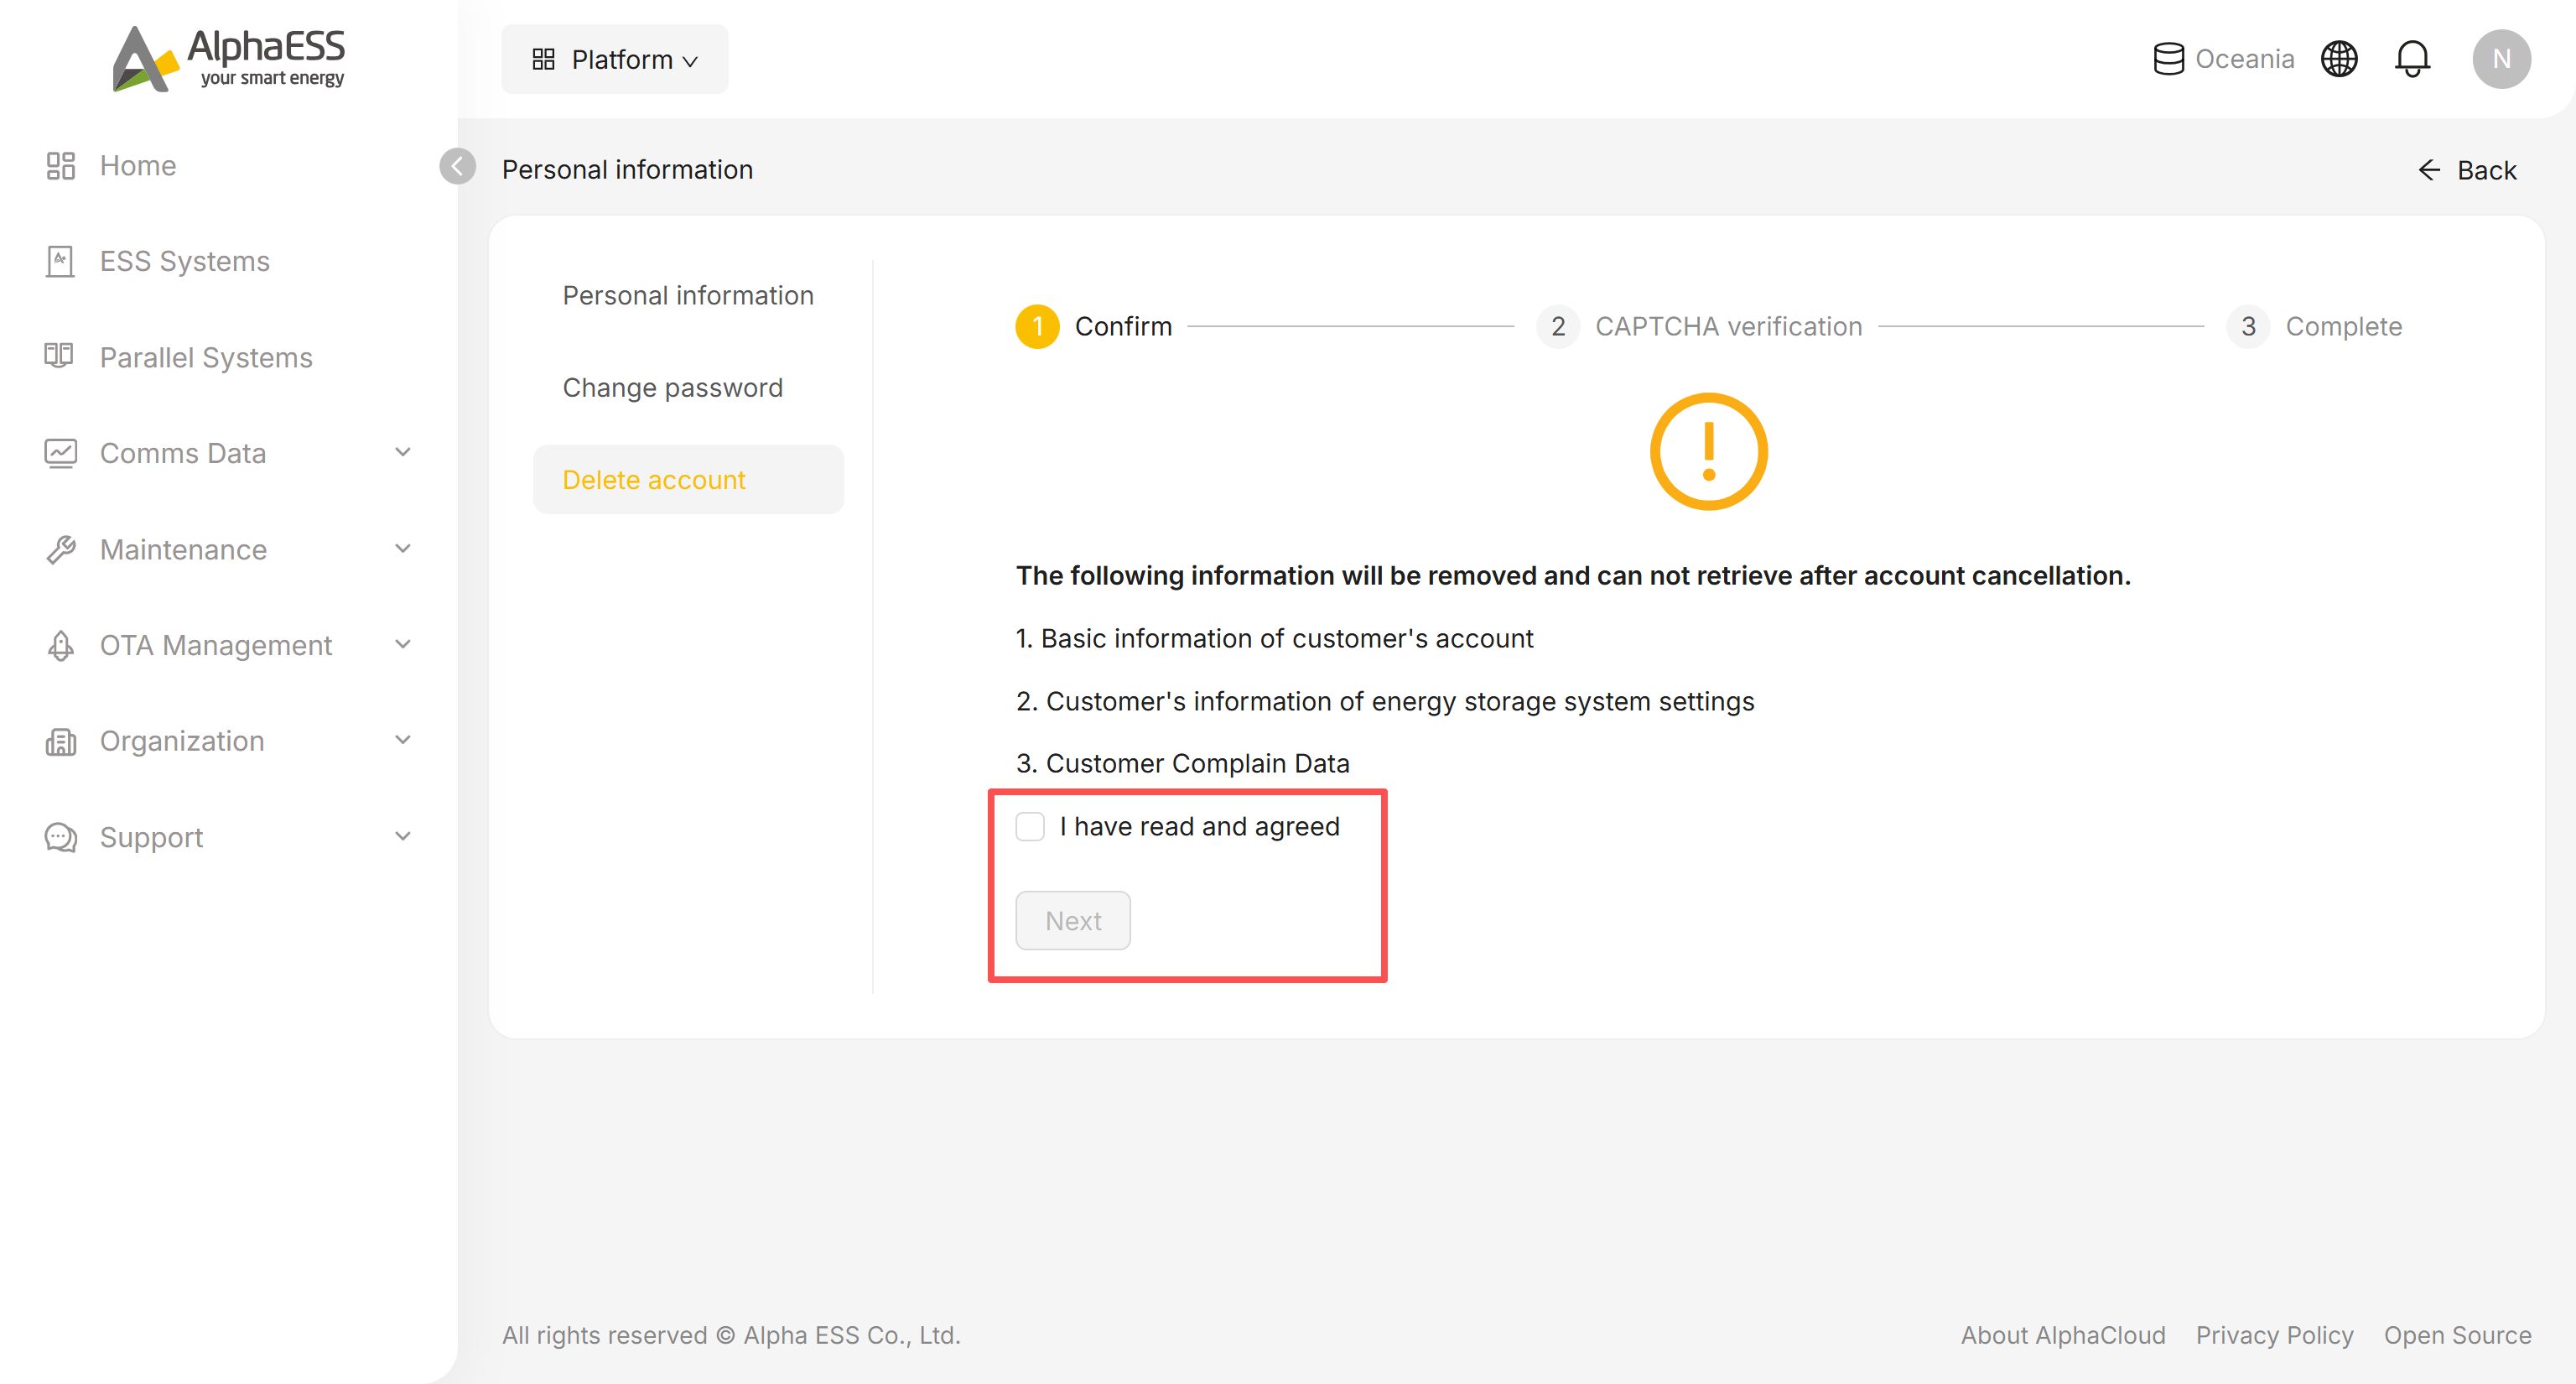
Delete account — permanently delete your account; you'll be asked to confirm before this takes effect.
Logout: signs you out of the current account.