

Daily Monitoring
This page covers the actions installers perform most frequently: locating a device from the system list, then opening its details to check operating status and energy data.
System list (ESS Systems)
In the Side Bar, select ESS Systems.
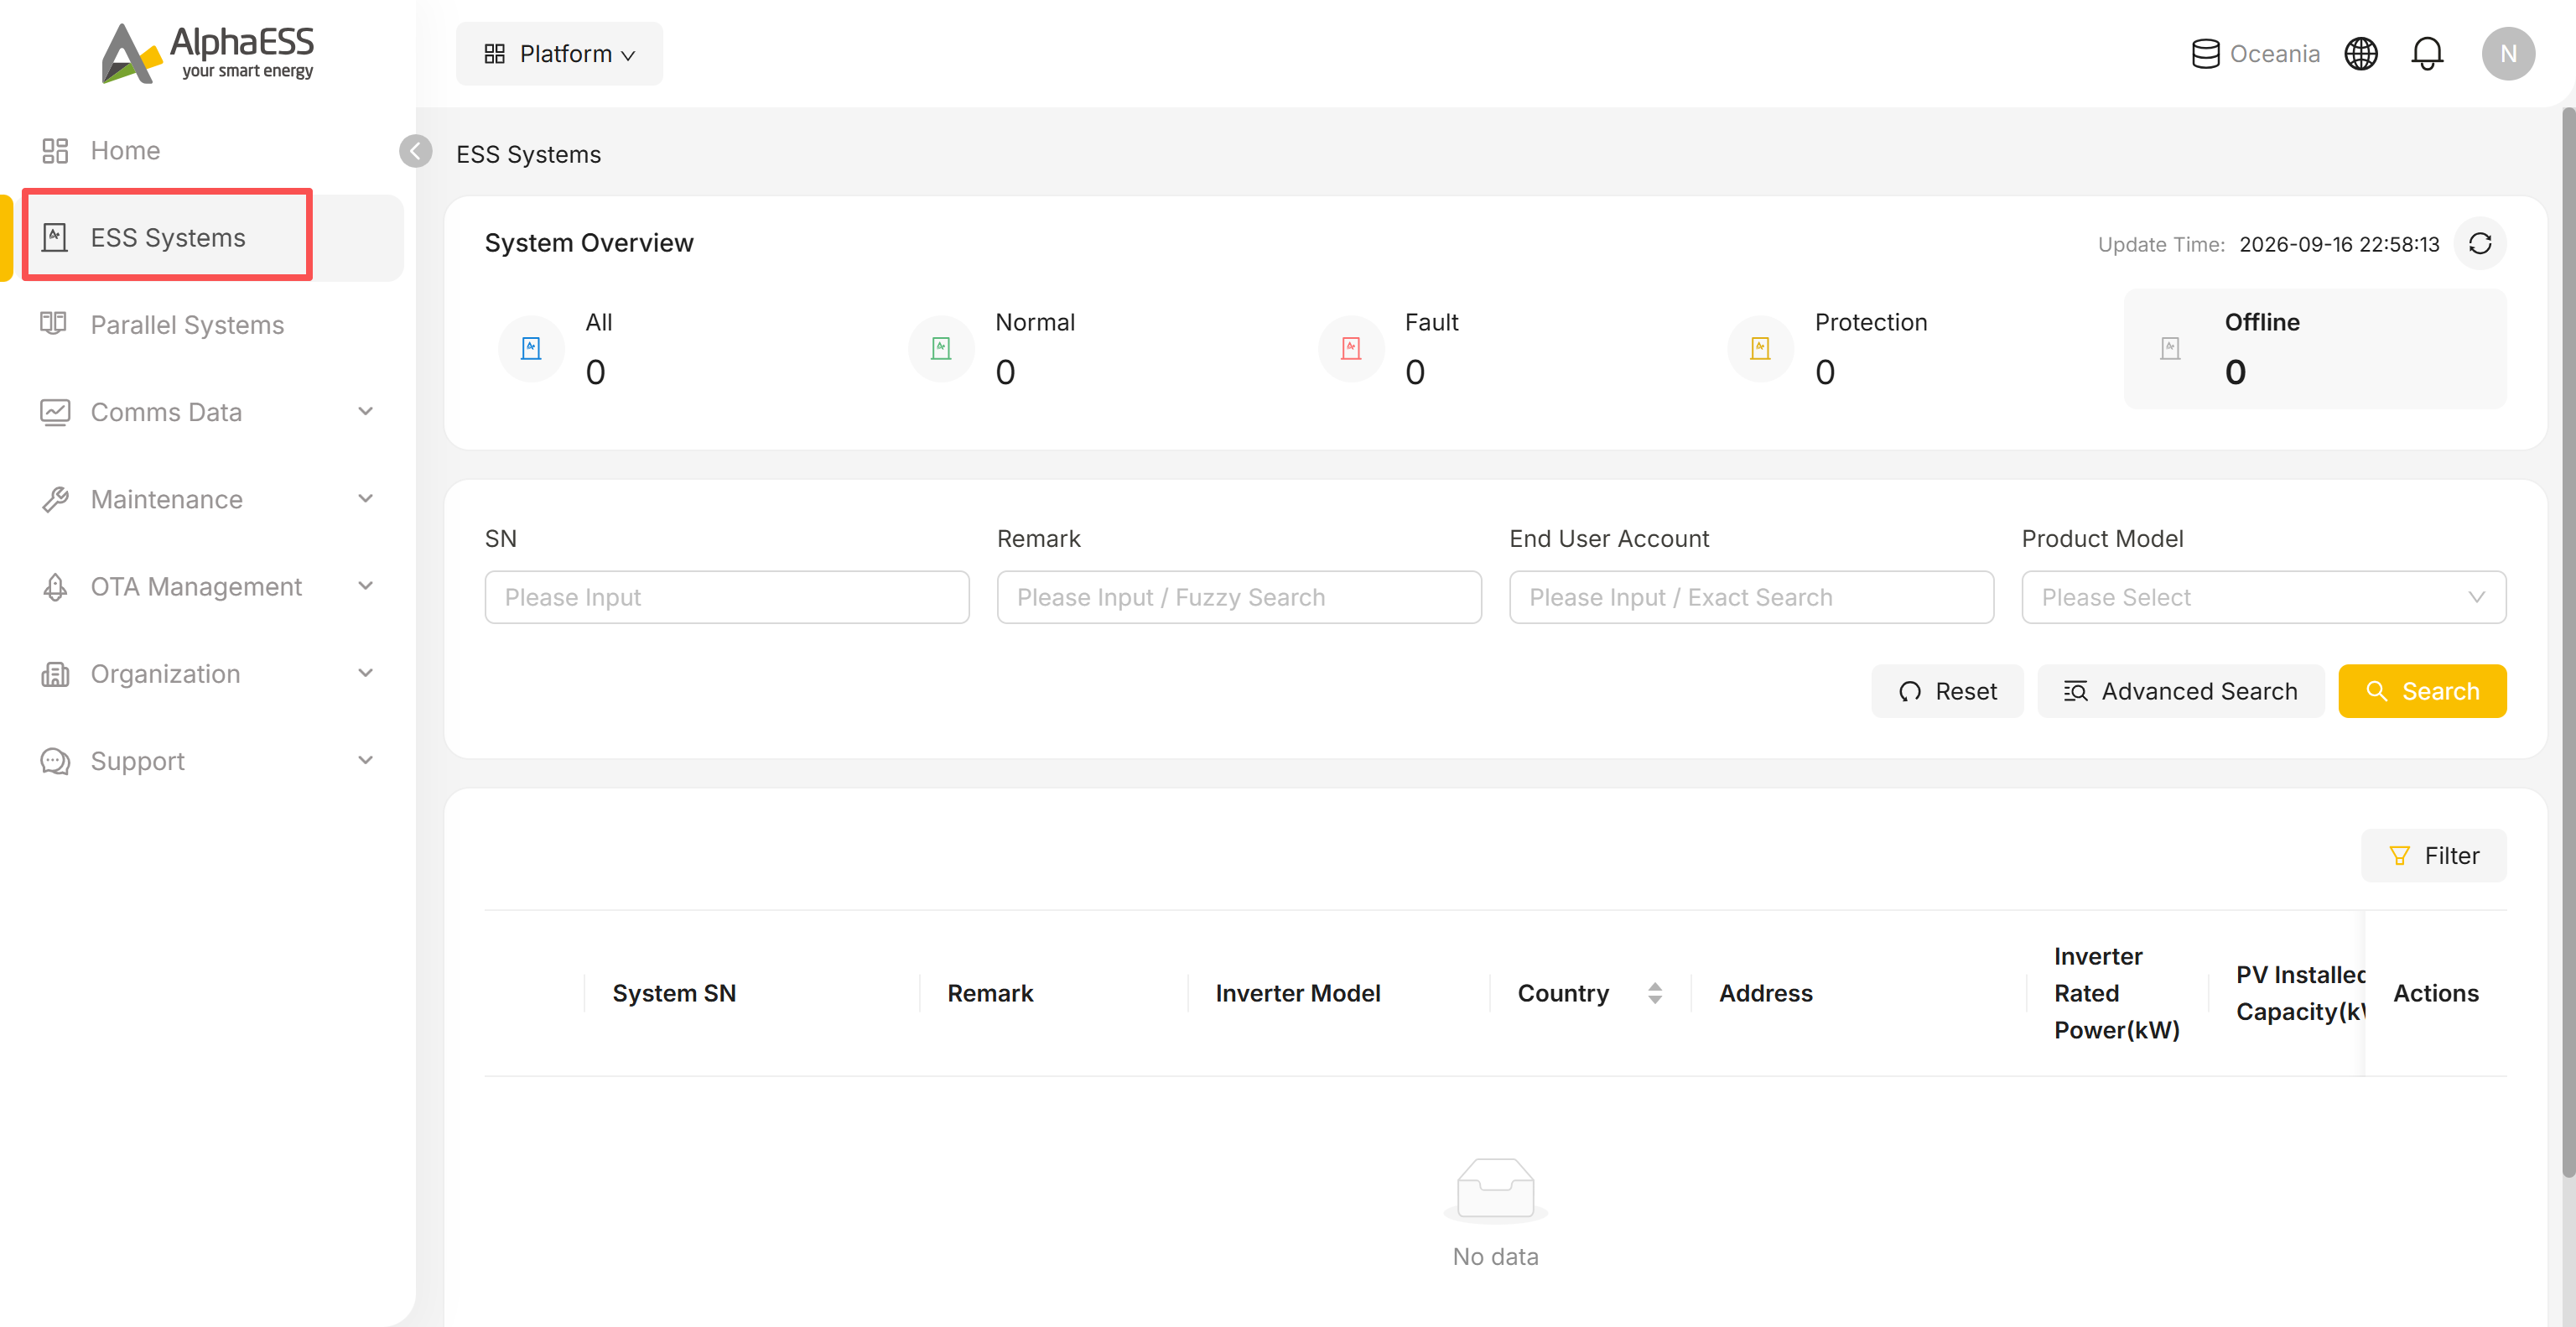
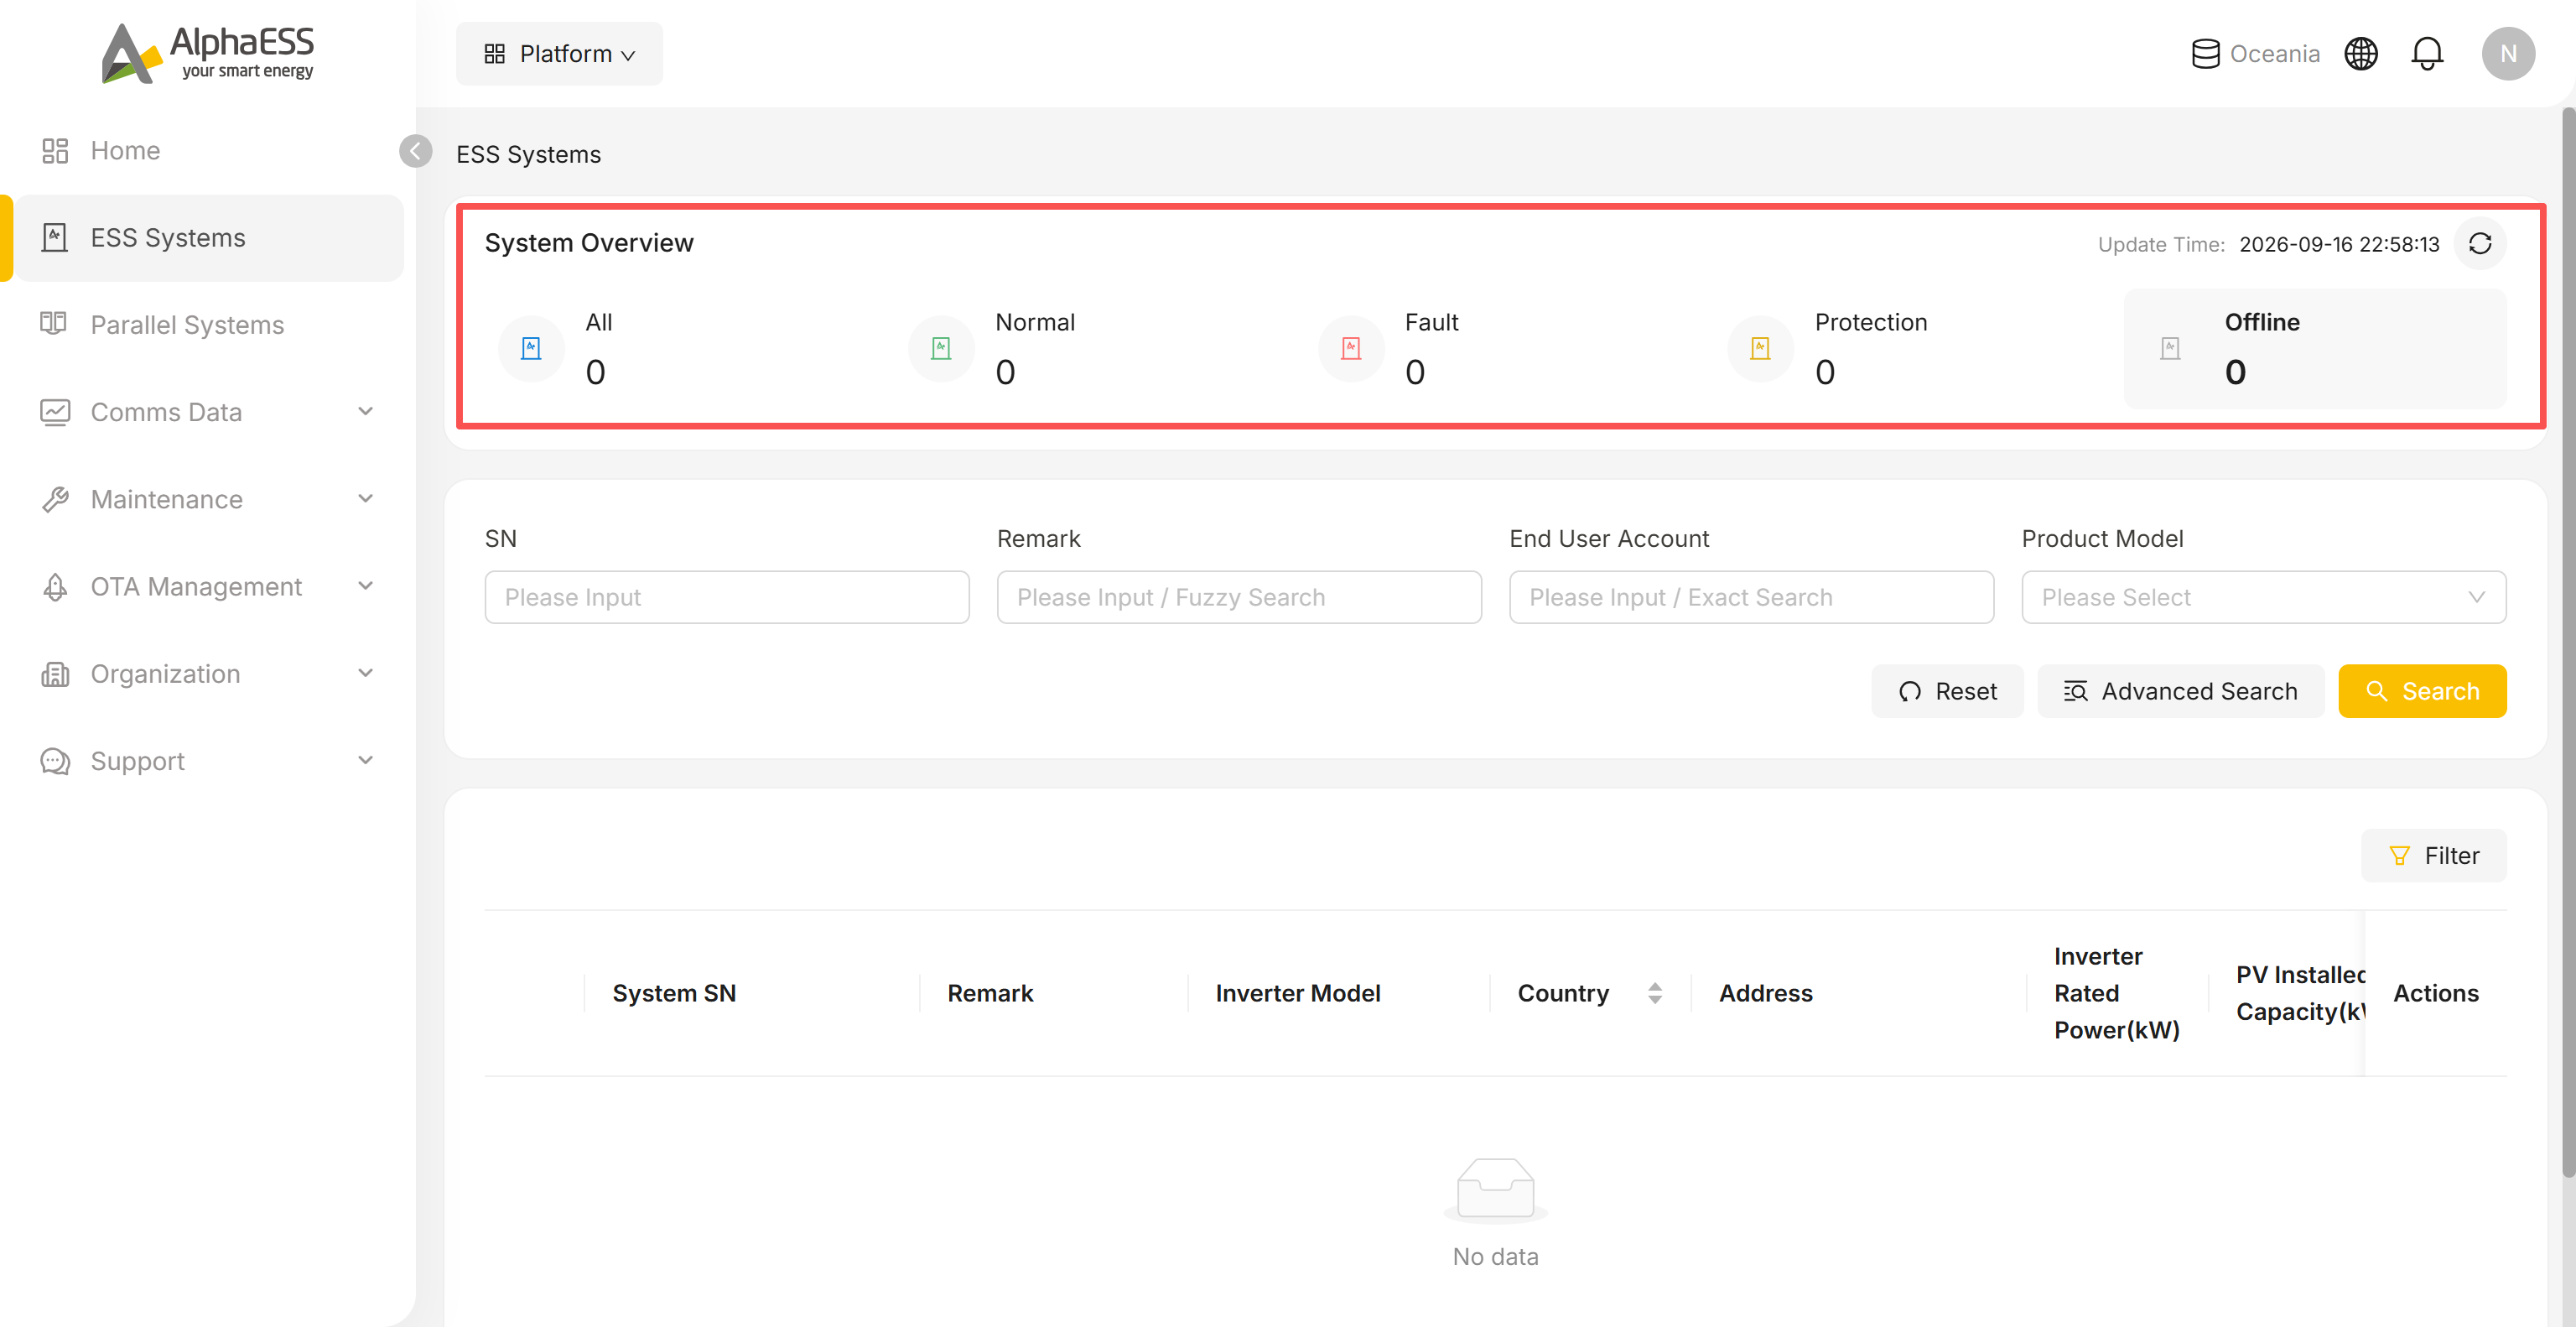
Check the System Overview status cards (All / Normal / Fault / Protection / Offline) at the top of the page. They update in real time next to an Update Time stamp and a refresh button — click a card to filter the list by that status.
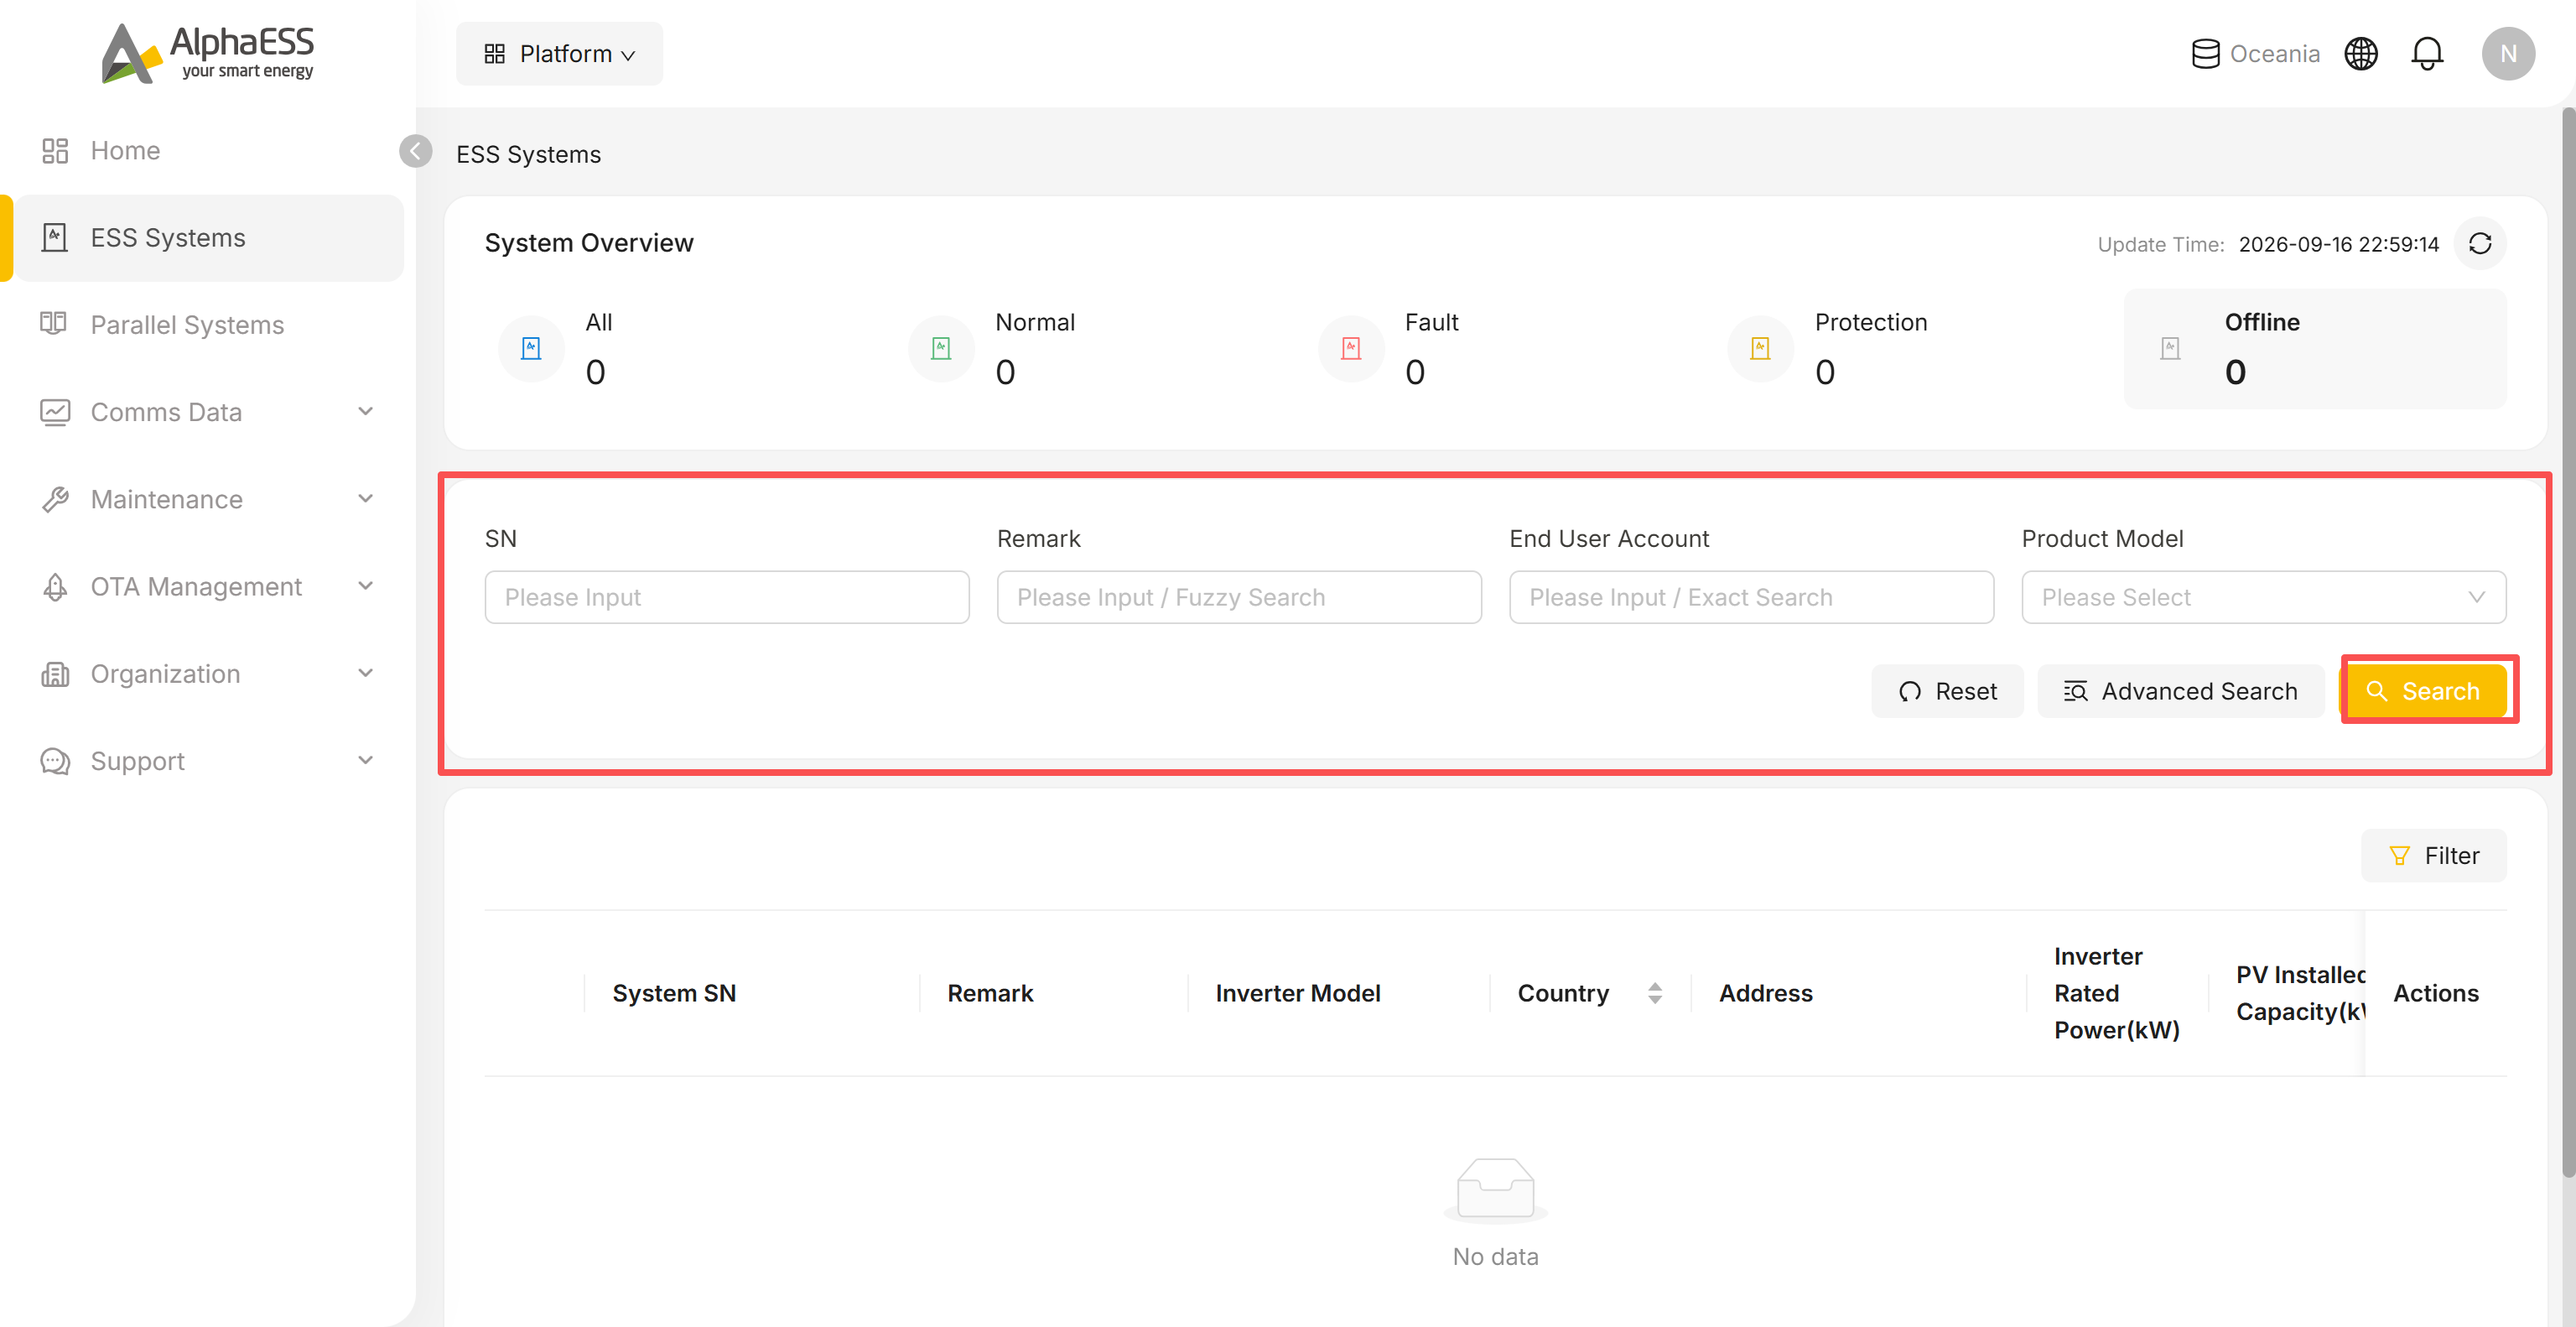
Run a basic search: enter SN, Remark, End User Account or select Product Model, then click Search.
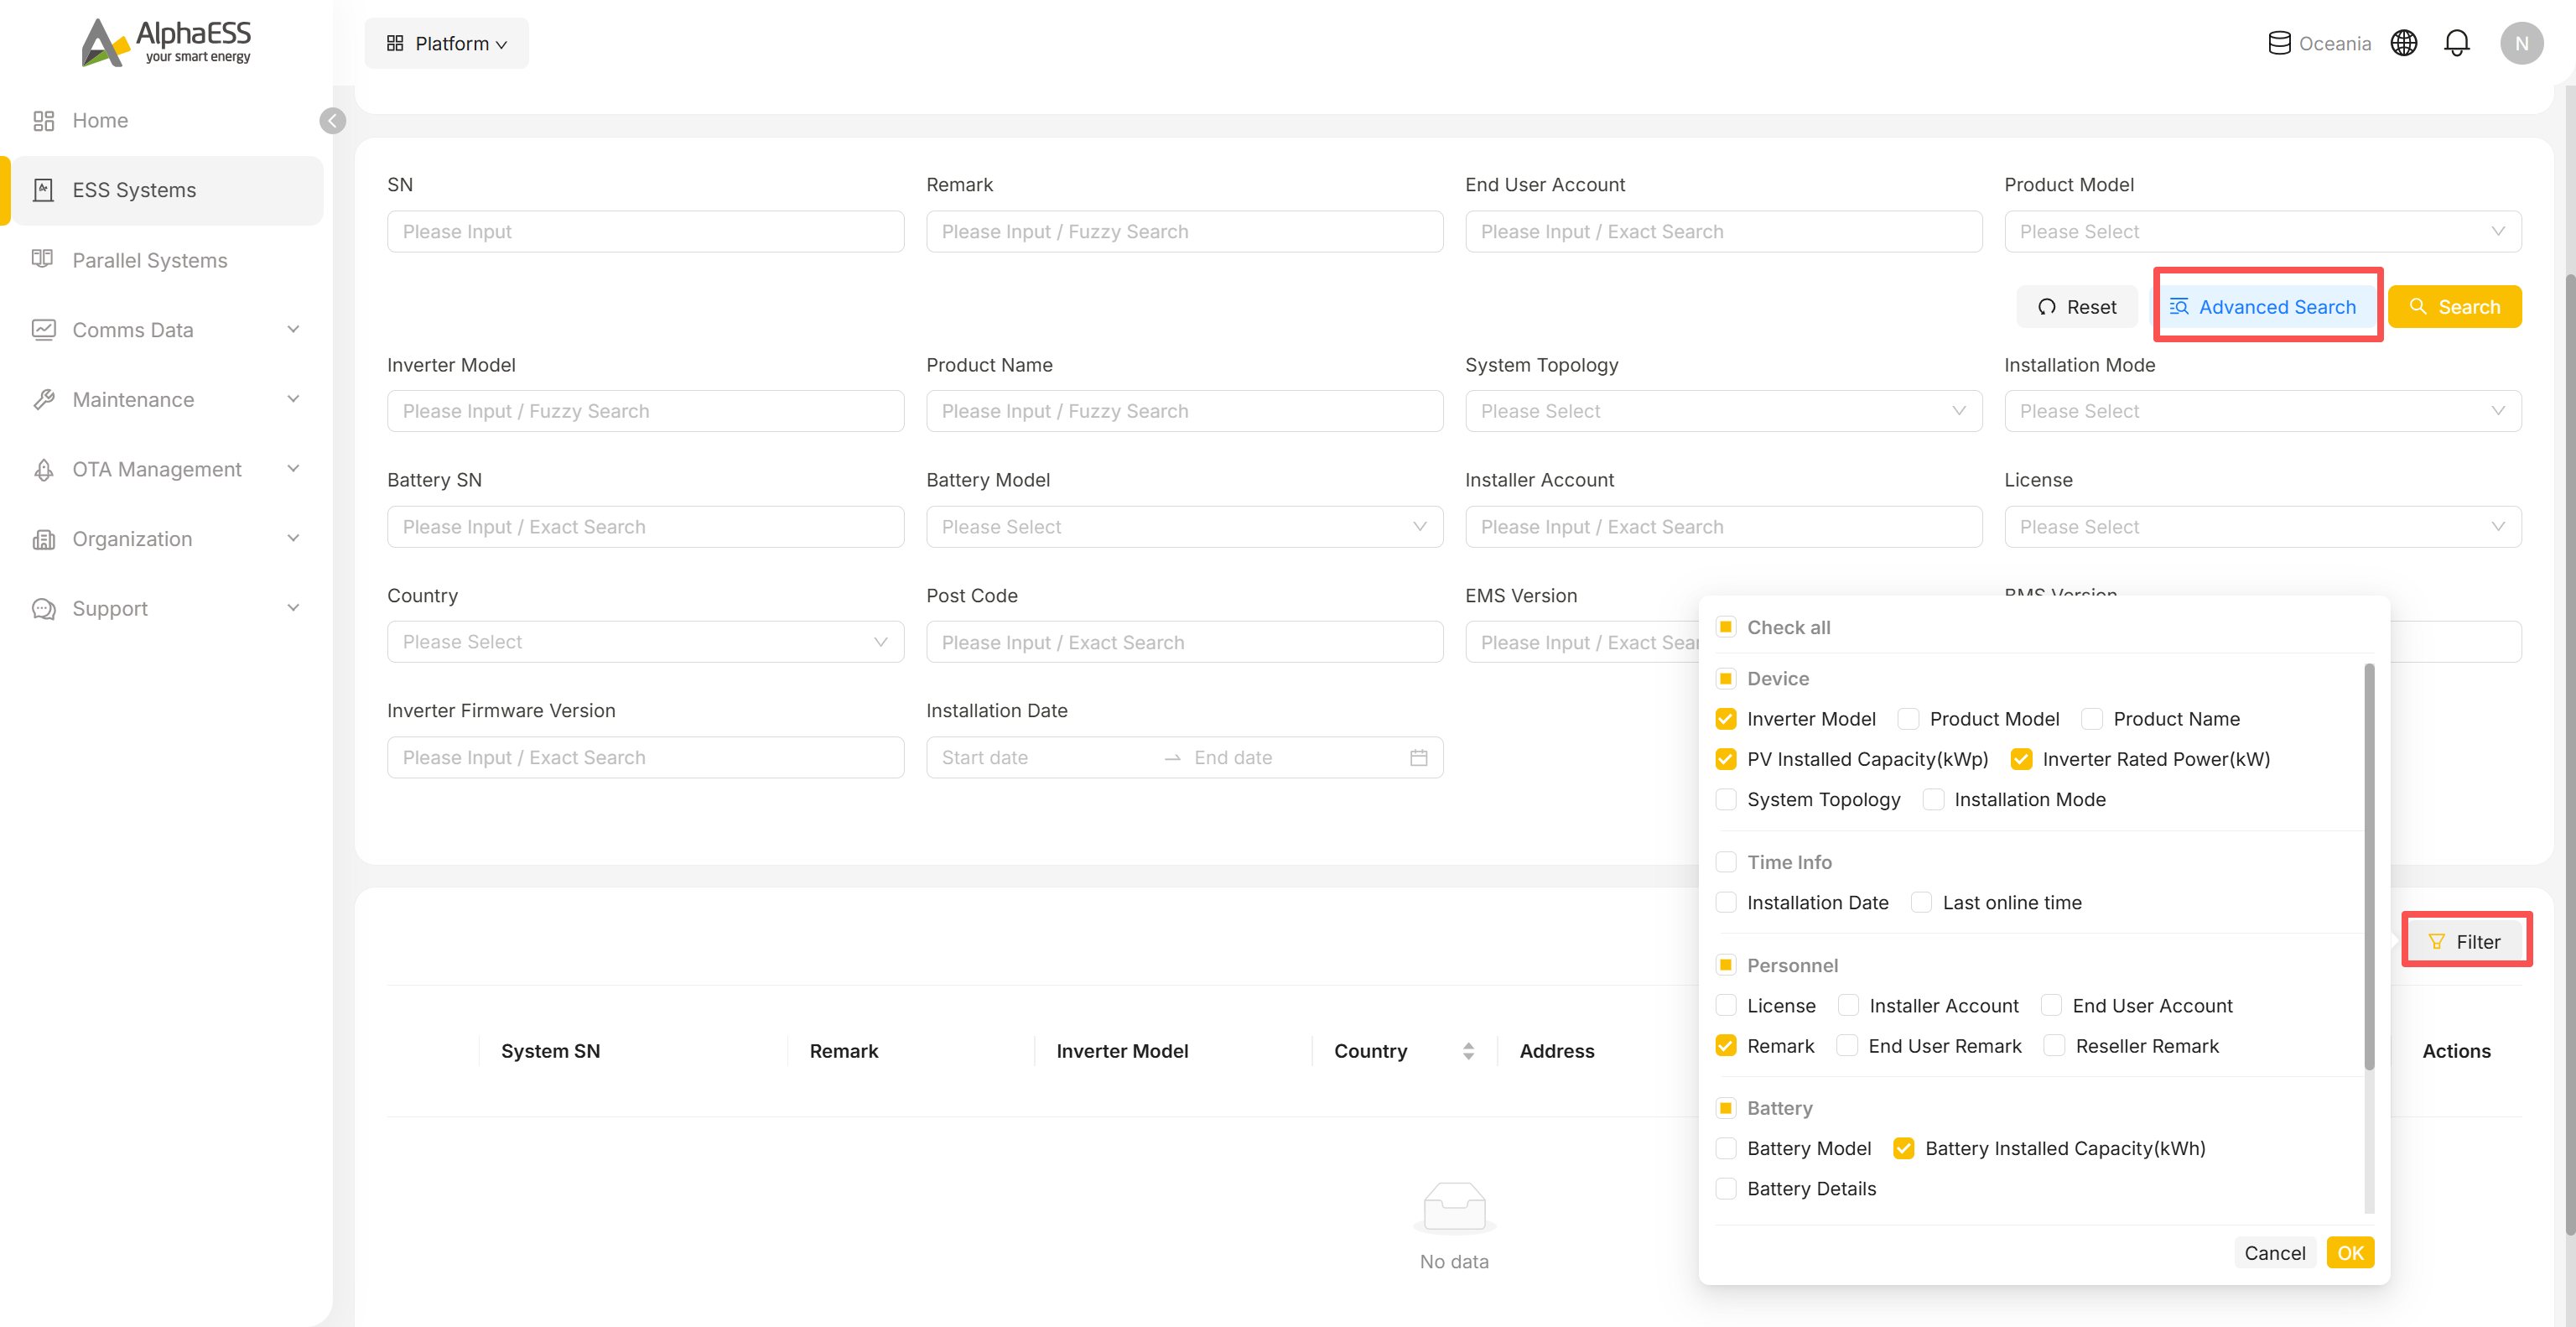
For more precise filtering, click Advanced Search to expand extra criteria:
- Inverter Model, Product Name, System Topology, Installation Mode, Battery SN, Battery Model, Installer Account, License, Country, Post Code, EMS / BMS / Inverter Firmware Version, and Installation Date
💡 Typical uses: before a firmware upgrade, use EMS Version + Country to narrow down the devices to be upgraded; for after-sales follow-up, use an Installation Date range to identify a particular batch of installations.
To customise which columns the table shows, click Filter above the table. Columns are grouped as:
- Device: Inverter Model, Product Model, Product Name, PV/Battery capacity, System Topology, Installation Mode
- Time Info: Installation Date, Last online time
- Personnel: License, Installer Account, End User Account, Remark and other remarks
- Battery: Battery Model, Battery Details
- Location: Country, Address, Post Code
Check the ones you want, then click OK.
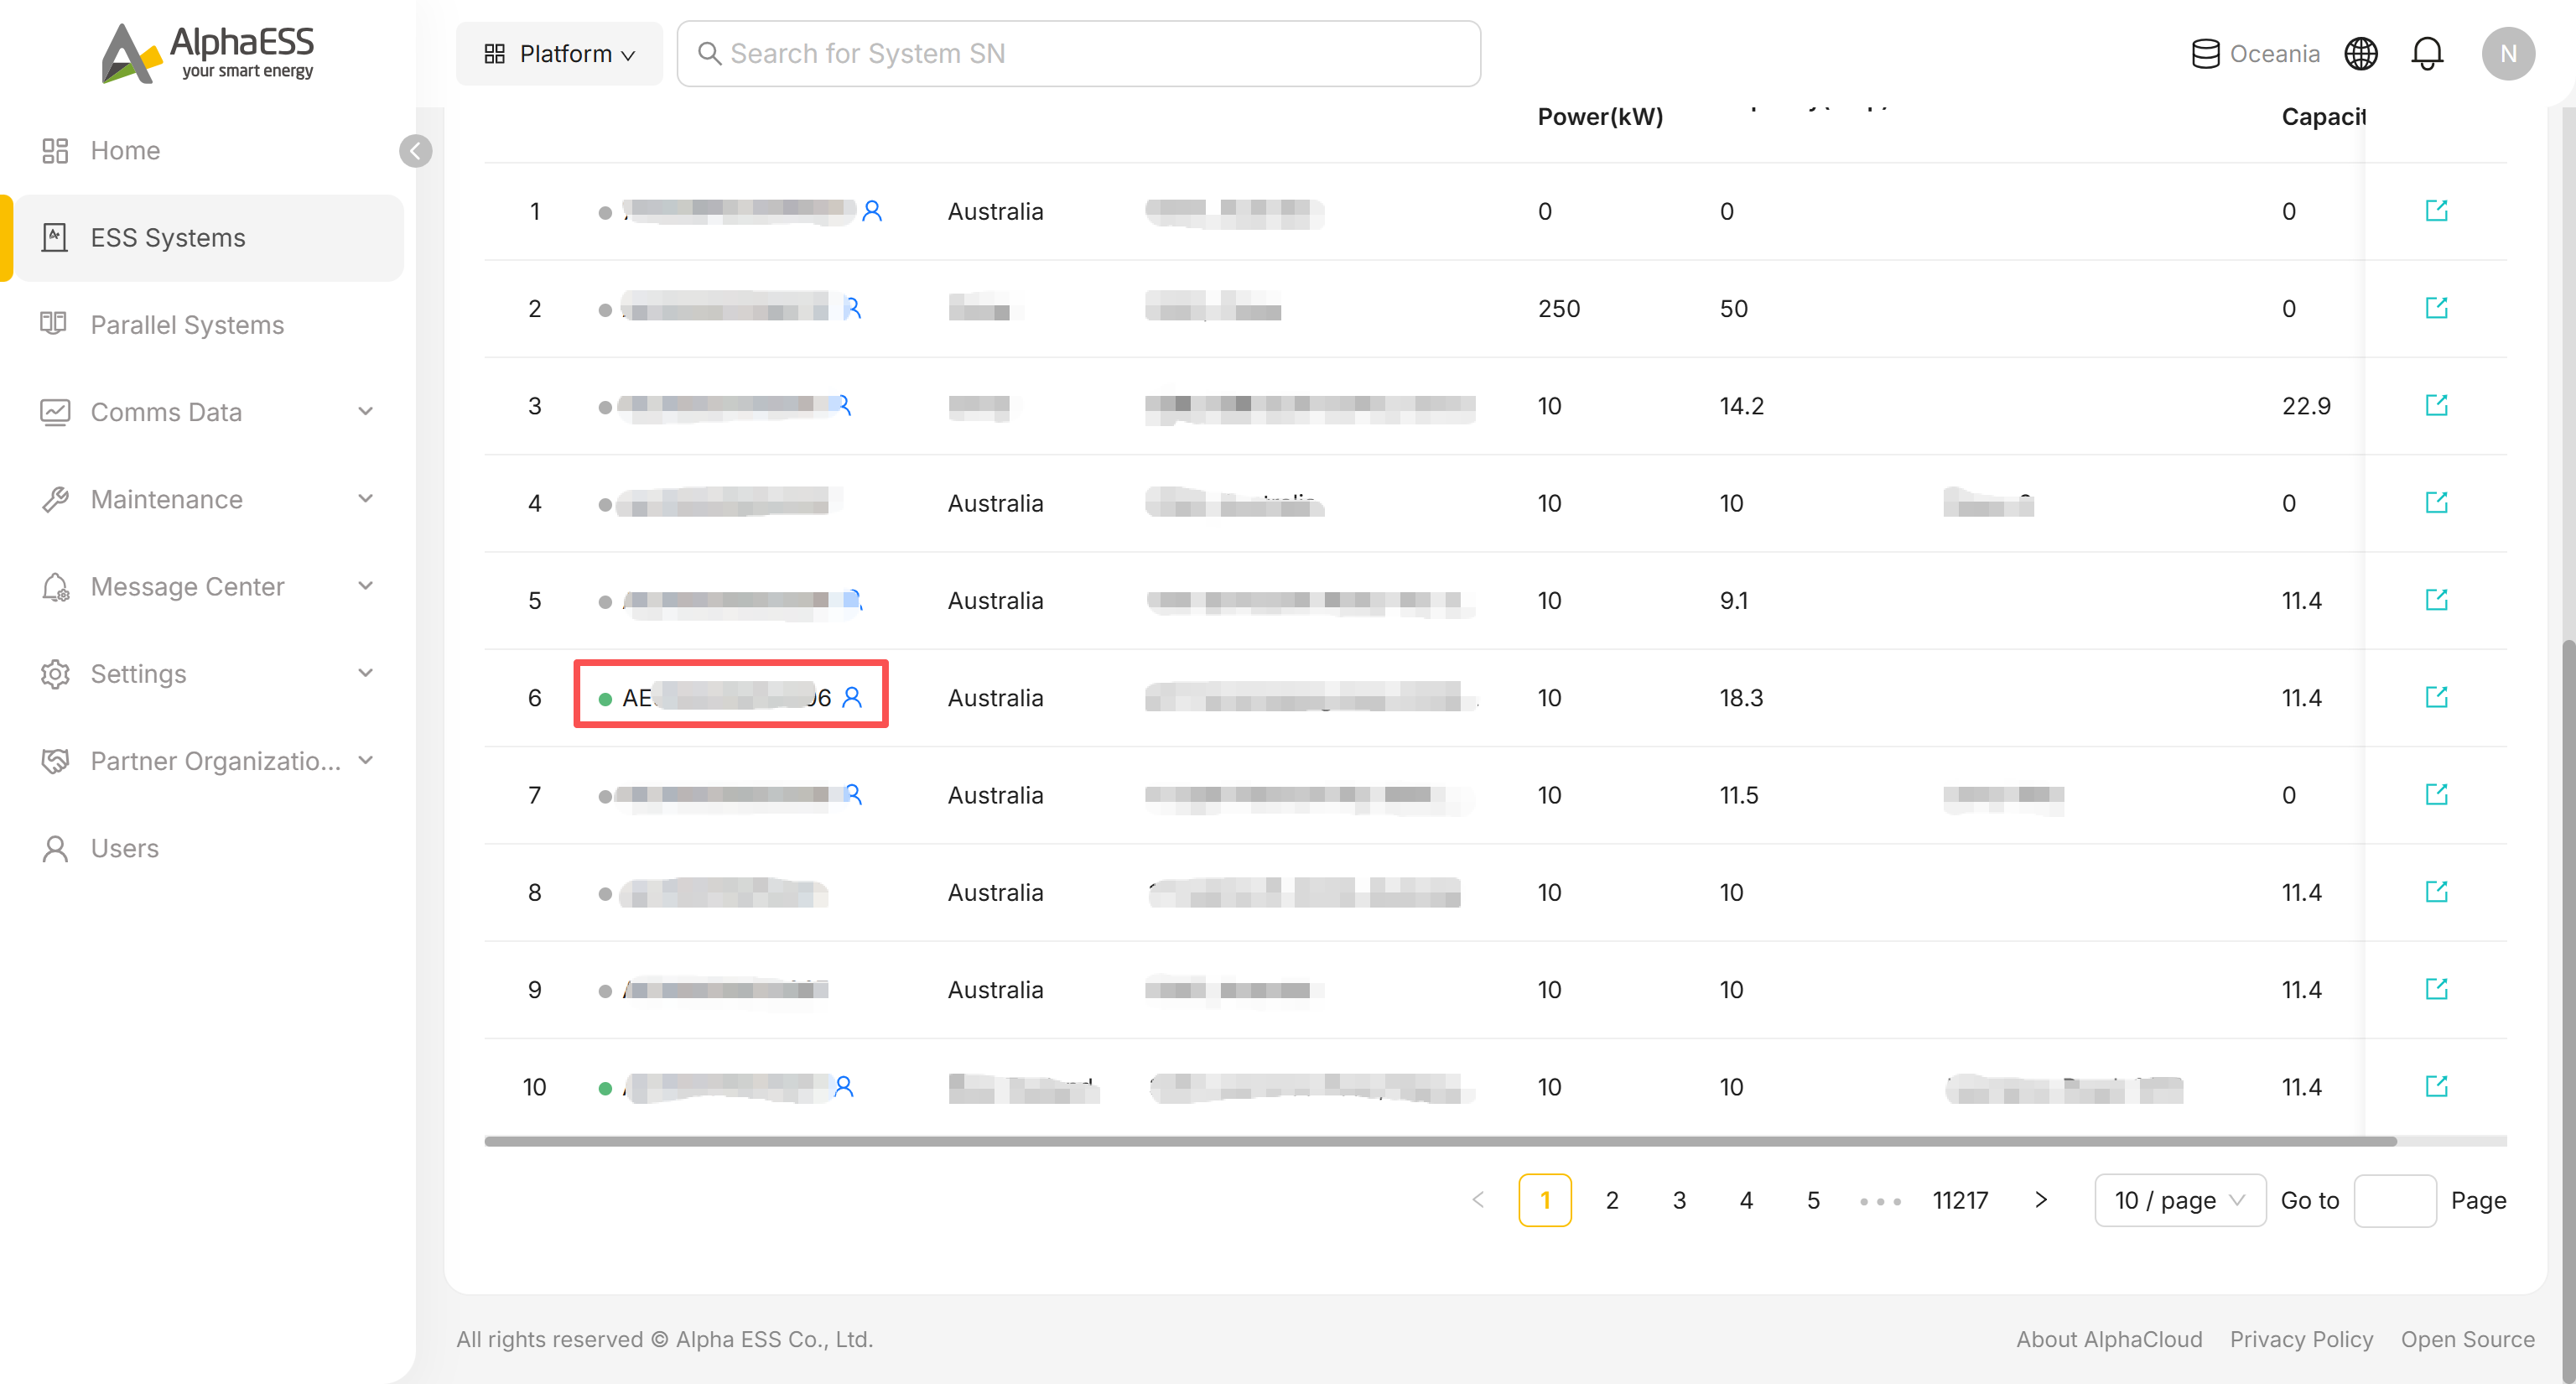
Click a System SN in the list to open that device details page.
Device details page: overview of the tabs
At the top of the details page is a breadcrumb along with 10 tabs:
- Breadcrumb: SN, operating mode, model, country, time zone
- Tabs: Site, System Settings, Firmware Versions, Warranty, Logs, Upgrades, Telemetry, Dashboard, Data Analysis, Function Code
For day-to-day monitoring you'll mainly use Site → Overview, Site → Devices and Dashboard, covered below. The other tabs are for configuration and after-sales work and are covered on their own pages:
- System Settings — 3.2 Remote Settings
- Firmware Versions, Warranty, Logs, Upgrades, Telemetry, Data Analysis and Function Code — 3.3 Maintenance and Troubleshooting
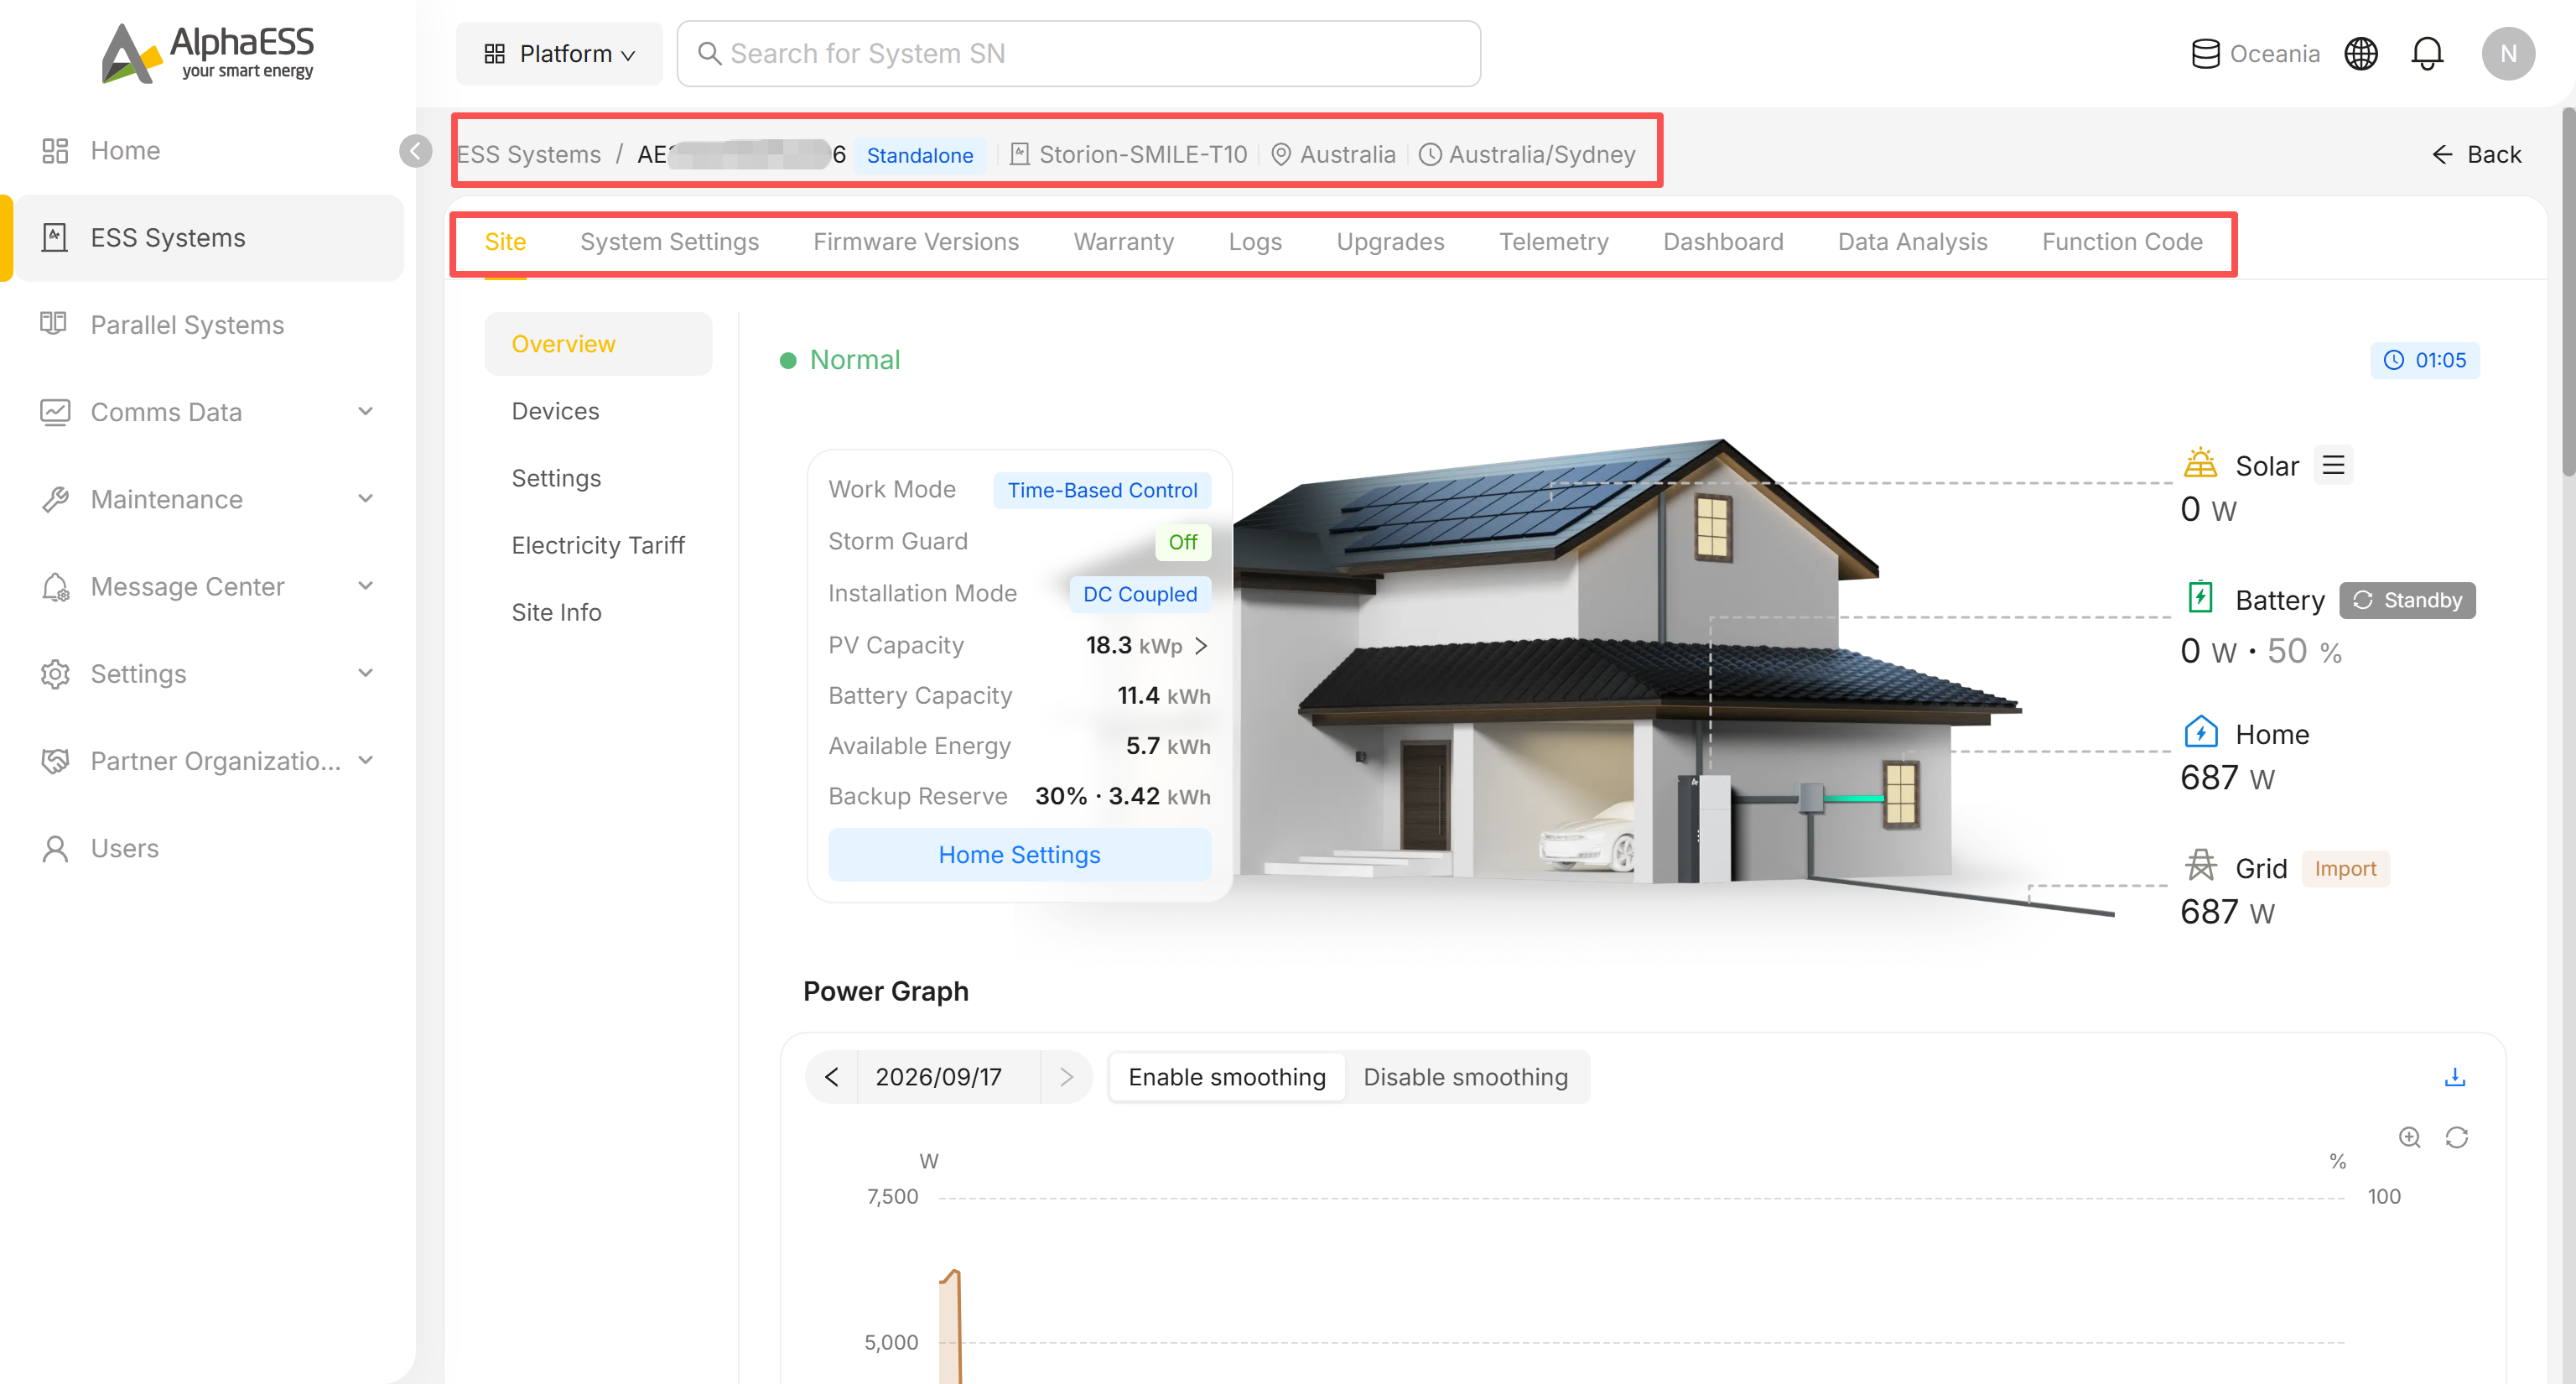
💡 Tip: Site itself has 5 sub-tabs — Overview, Devices, Settings, Electricity Tariff and Site Info. Settings, Electricity Tariff and Site Info are also covered on 3.2 Remote Settings.
Site → Overview
This is the first place to look during a routine check.
Status row and information cards
At the top of the page is a status dot with the operating state (Normal / Fault / ...) and a last-updated timestamp.
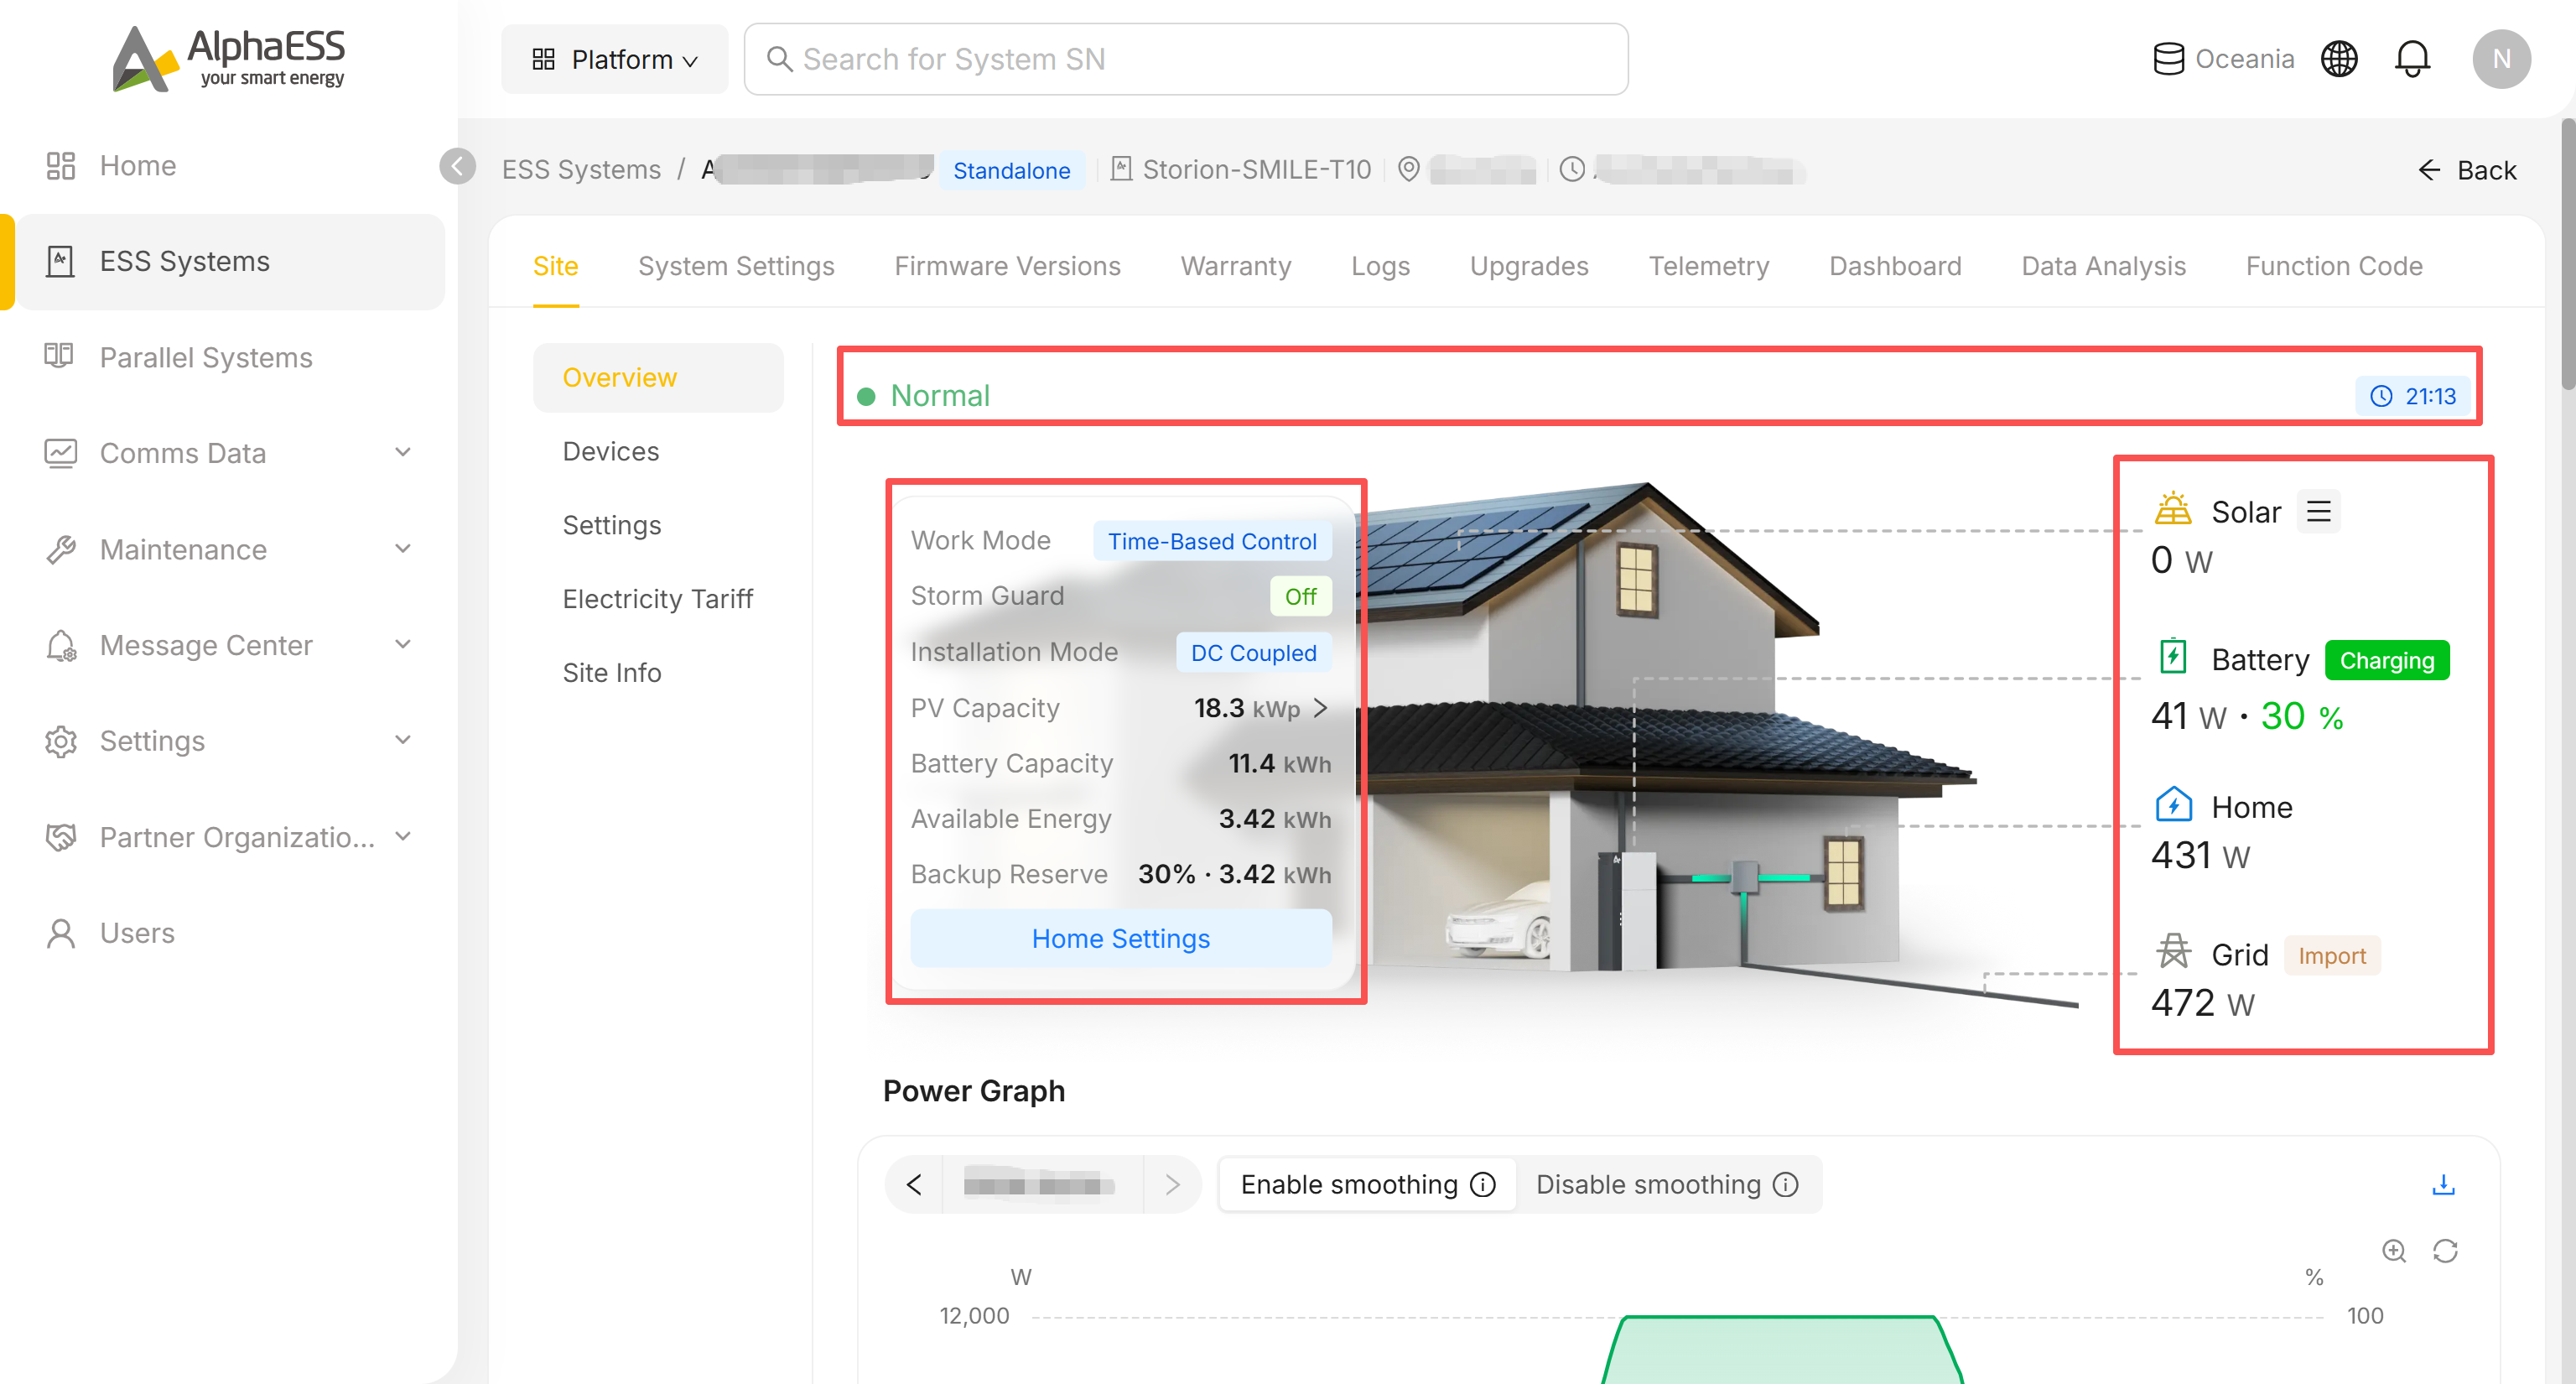
Below it, the left-hand cards show:
- Work Mode, Storm Guard, Installation Mode, PV Capacity (click the
>to see the breakdown), Battery Capacity, Available Energy and Backup Reserve
Click Home Settings to make quick adjustments.
Next to the cards, the house diagram shows an animated real-time energy flow with live power at all four points — Solar / Battery / Home / Grid. Battery and Grid also show a state label that flips with the direction of flow: Charging / Discharging for Battery, Import / Export for Grid.
Power Graph
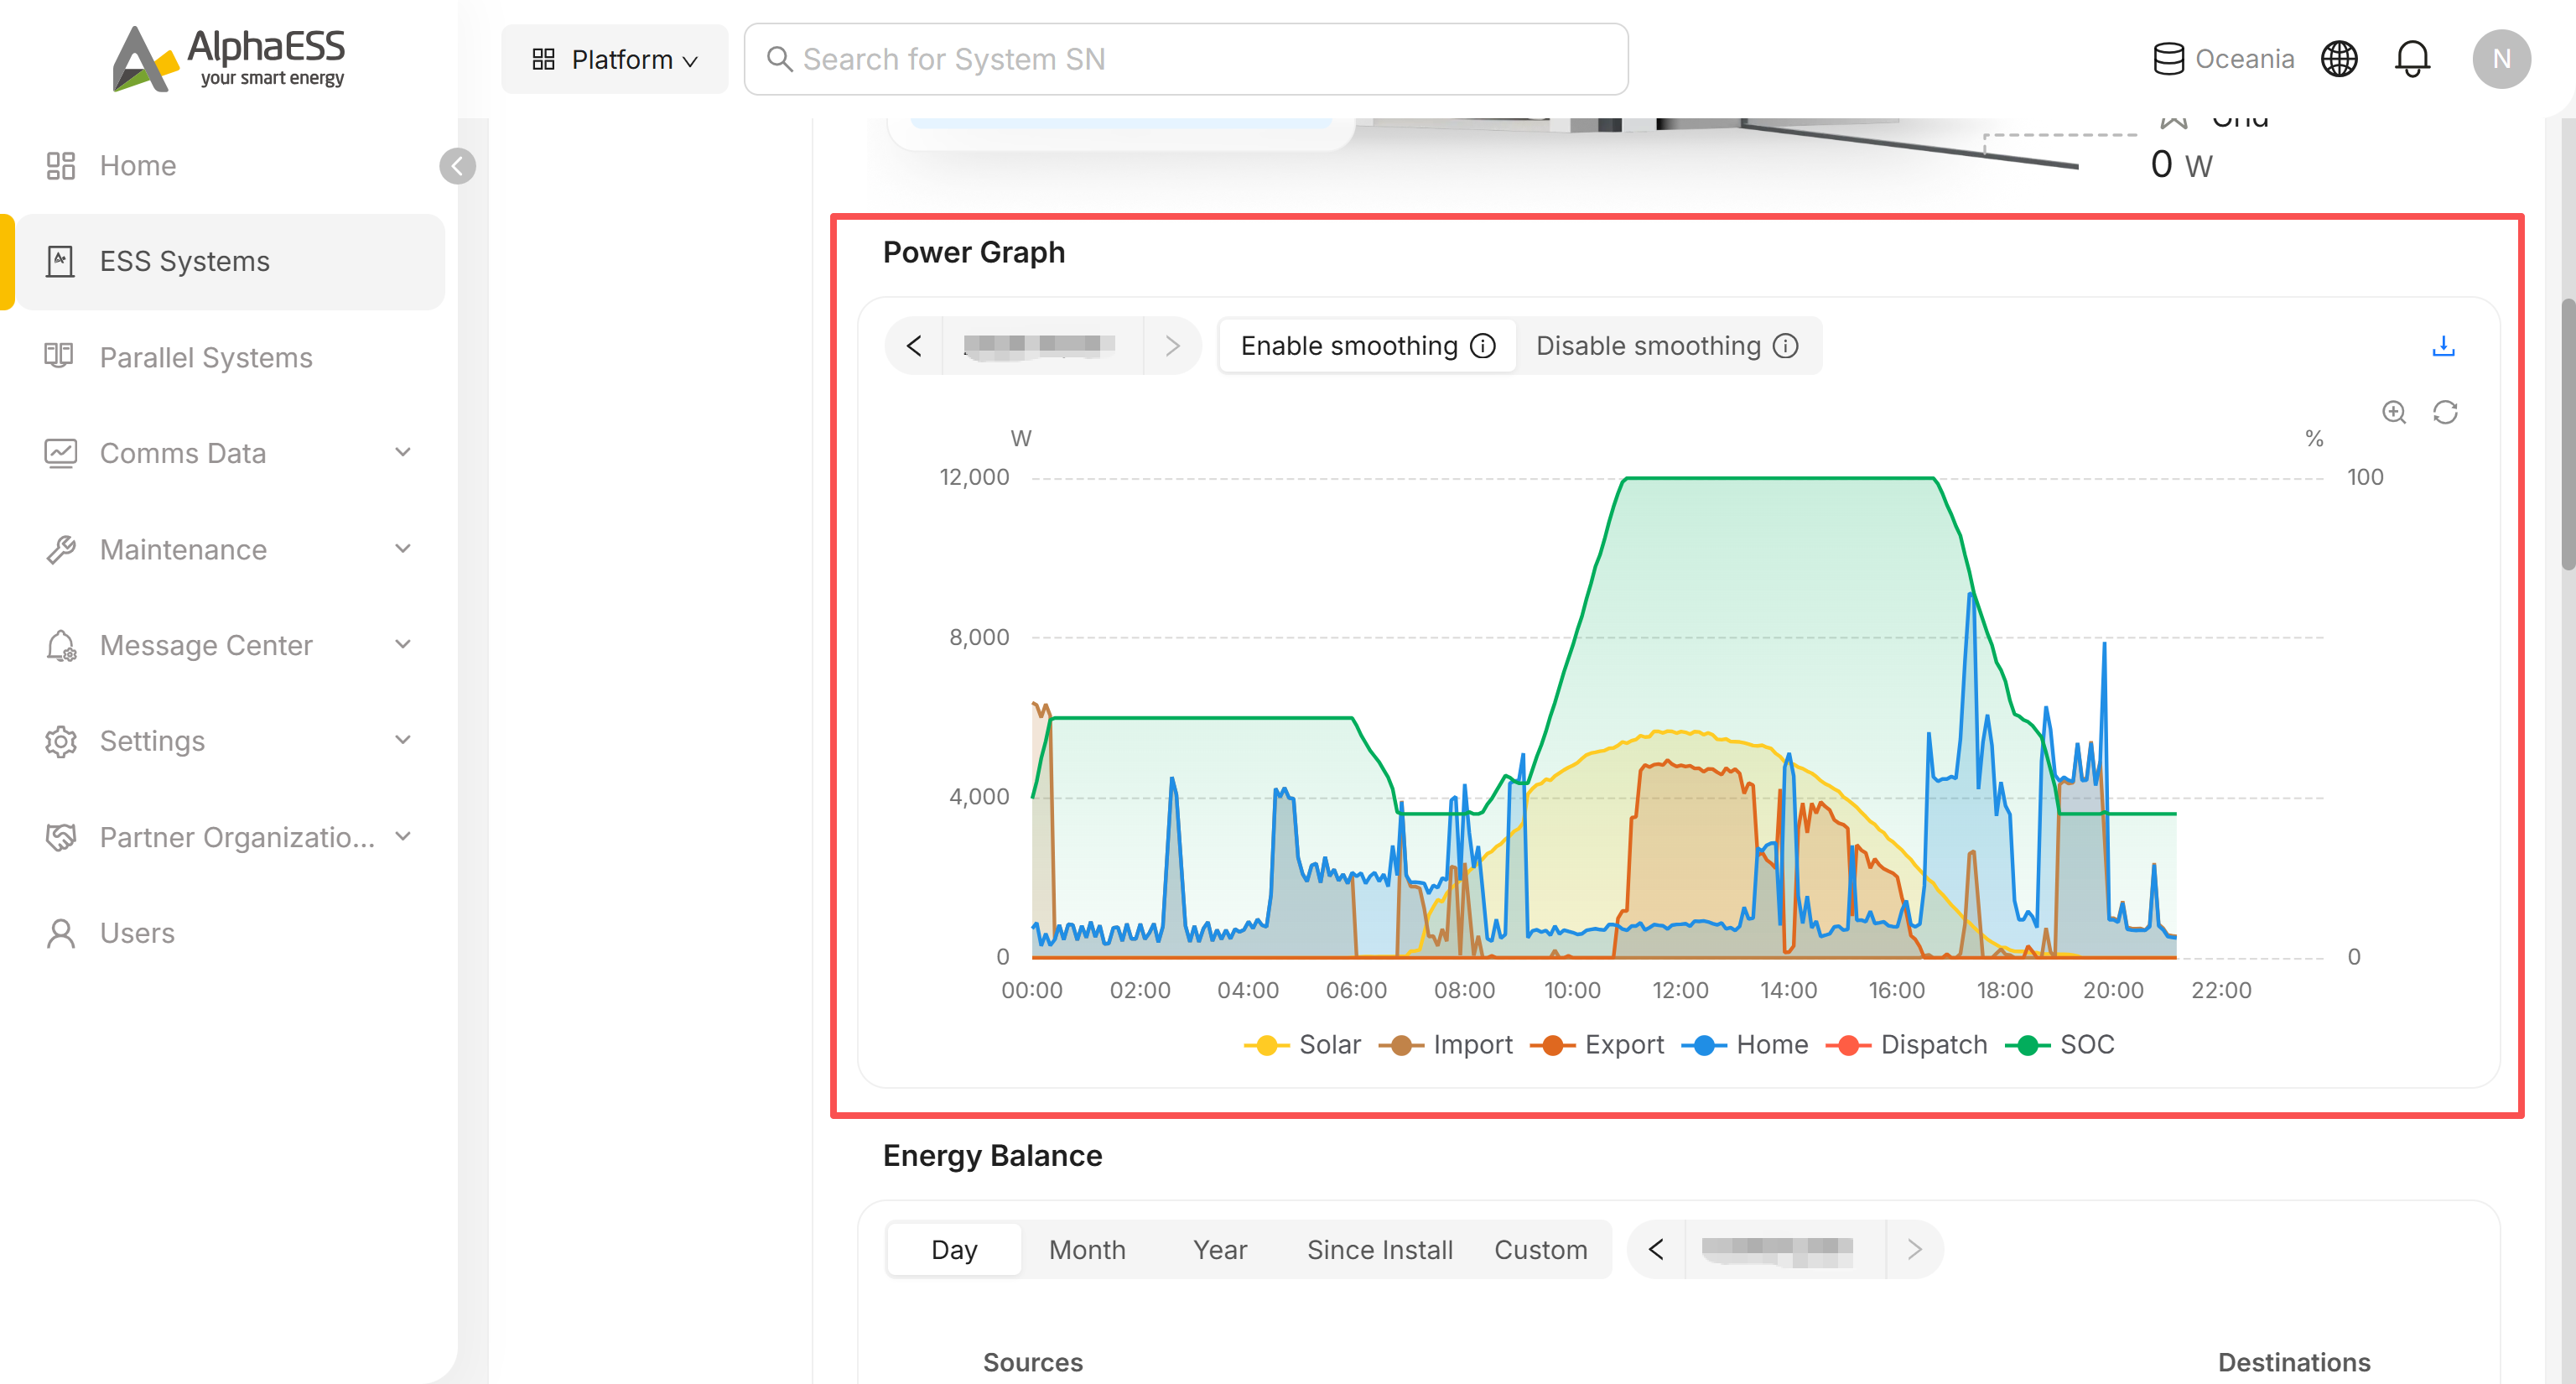
The power curve for the selected day, with:
- Enable smoothing / Disable smoothing (each has an info icon with more detail on hover)
- A download icon to export the chart data
- Zoom and refresh icons on the chart itself
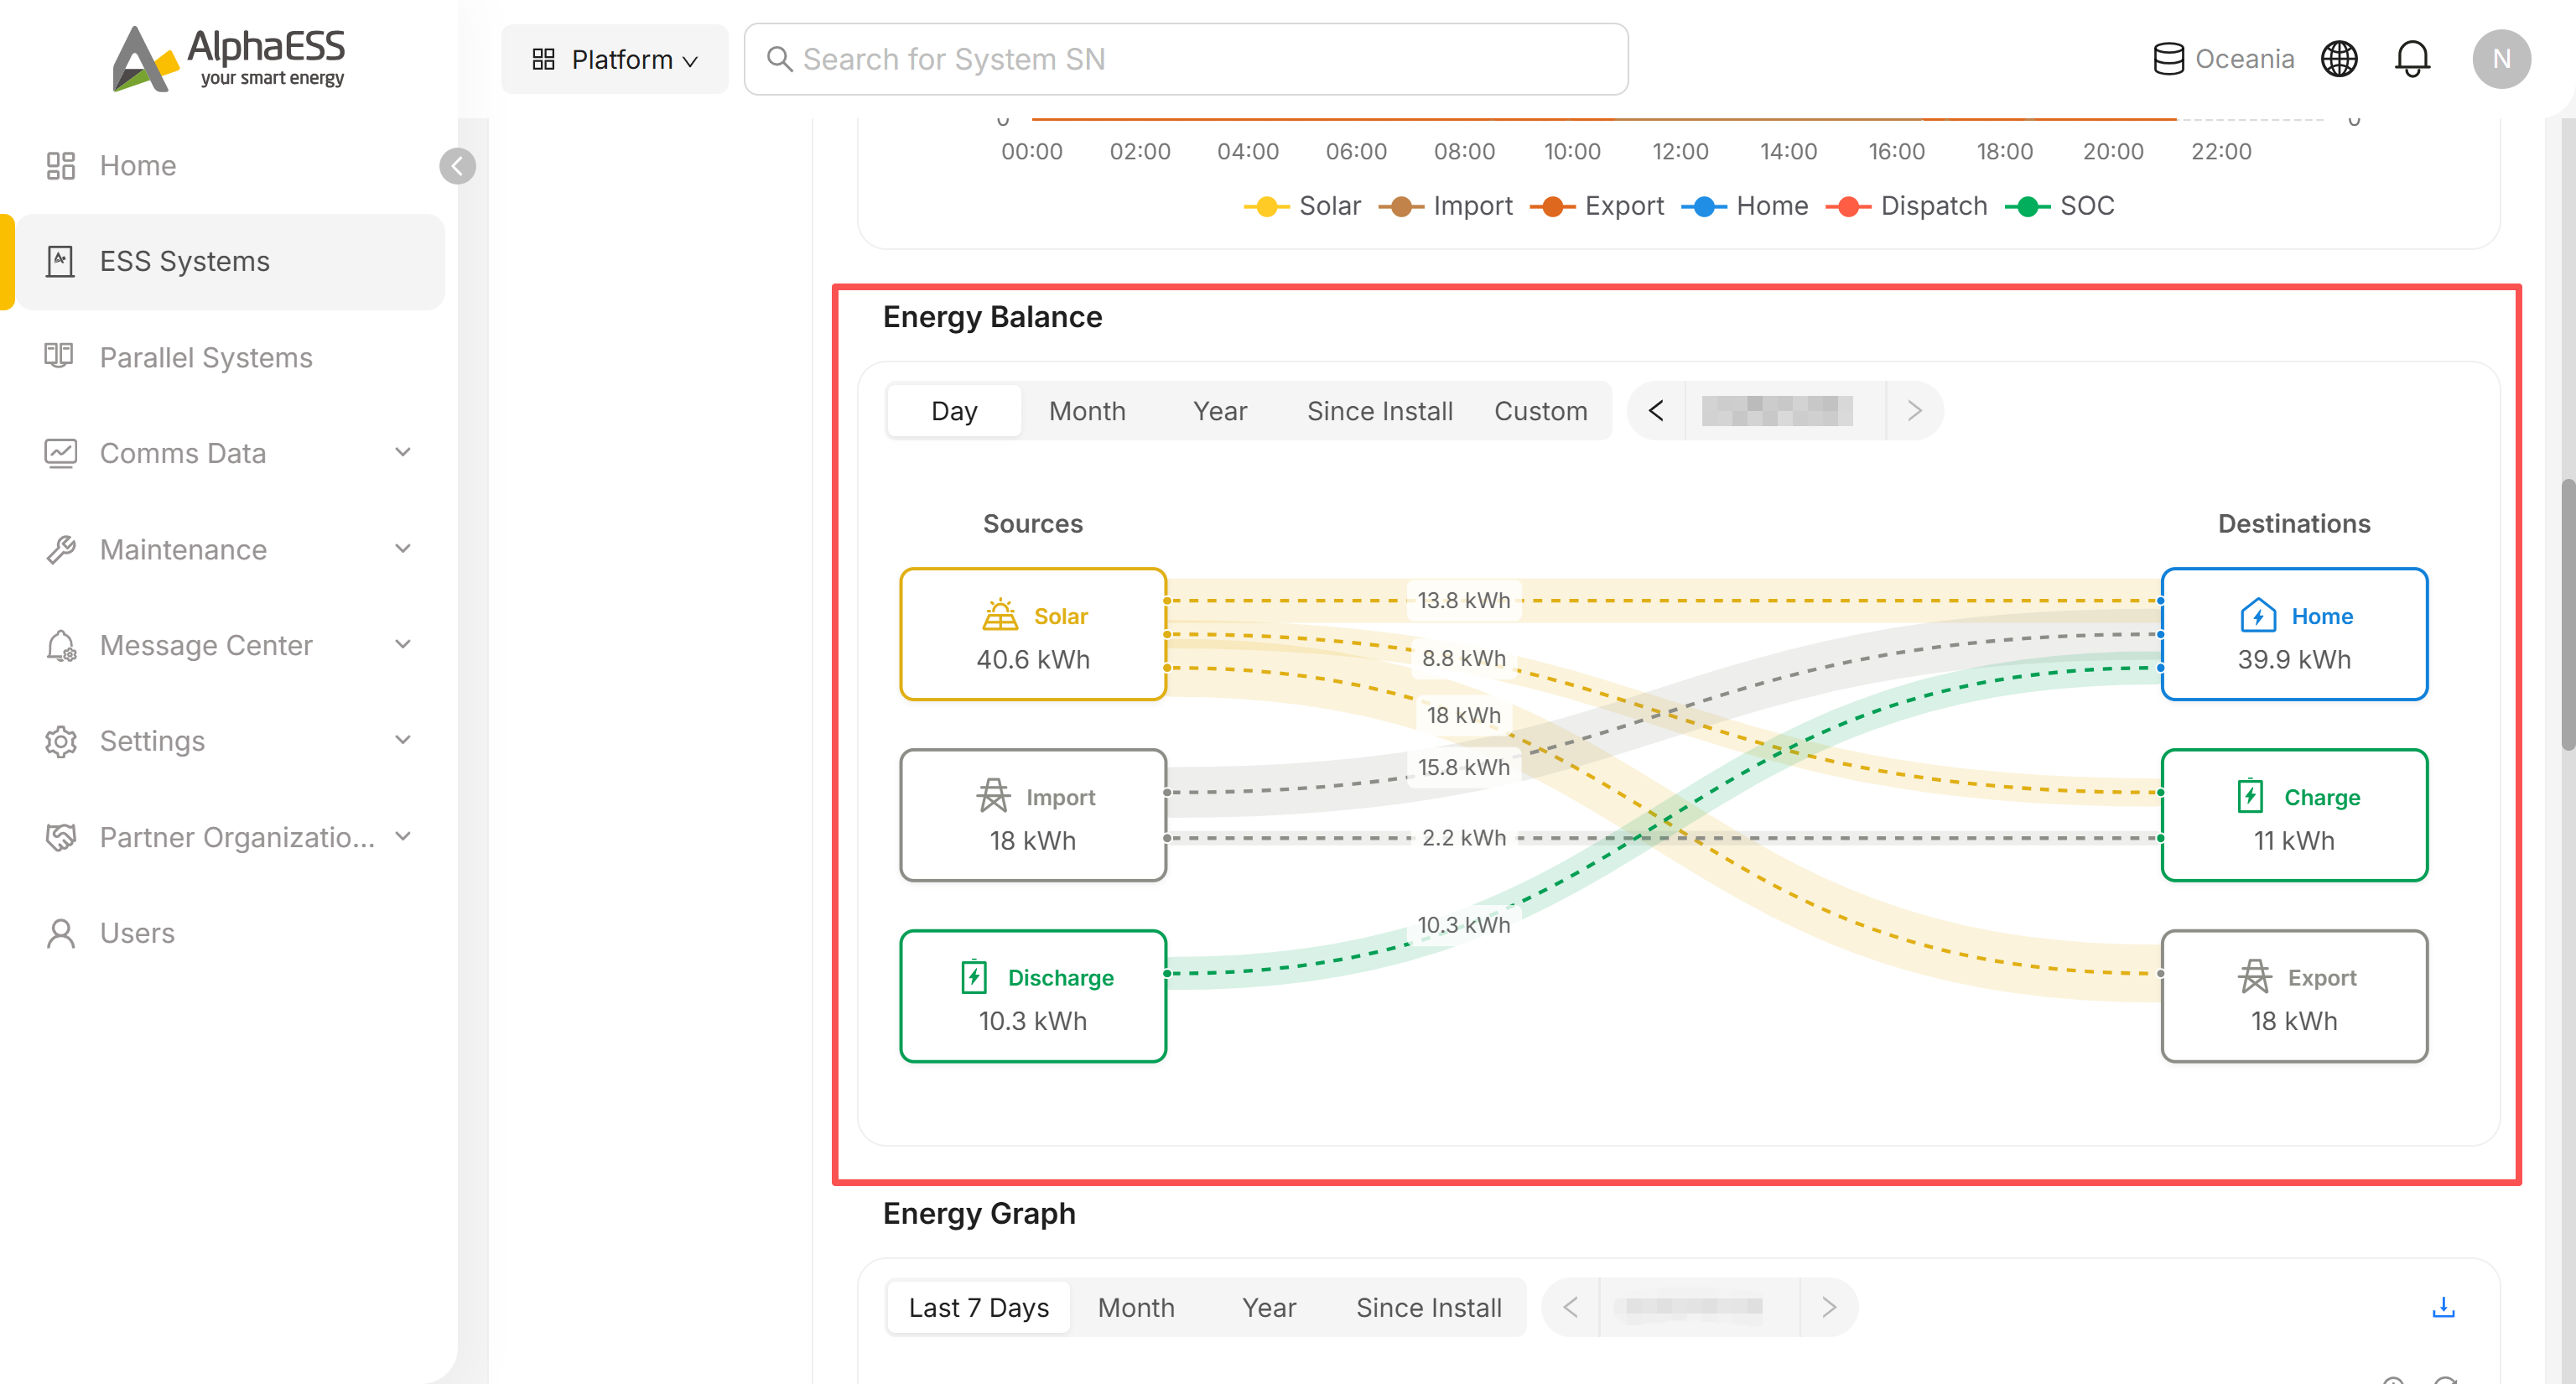
Energy Balance
A Sankey-style diagram, selectable by Day / Month / Year / Since Install / Custom (with a date picker next to the period switch). Sources (Solar / Import / Discharge) flow into Destinations (Home / Charge / Export); every node and connecting line shows its own kWh value.
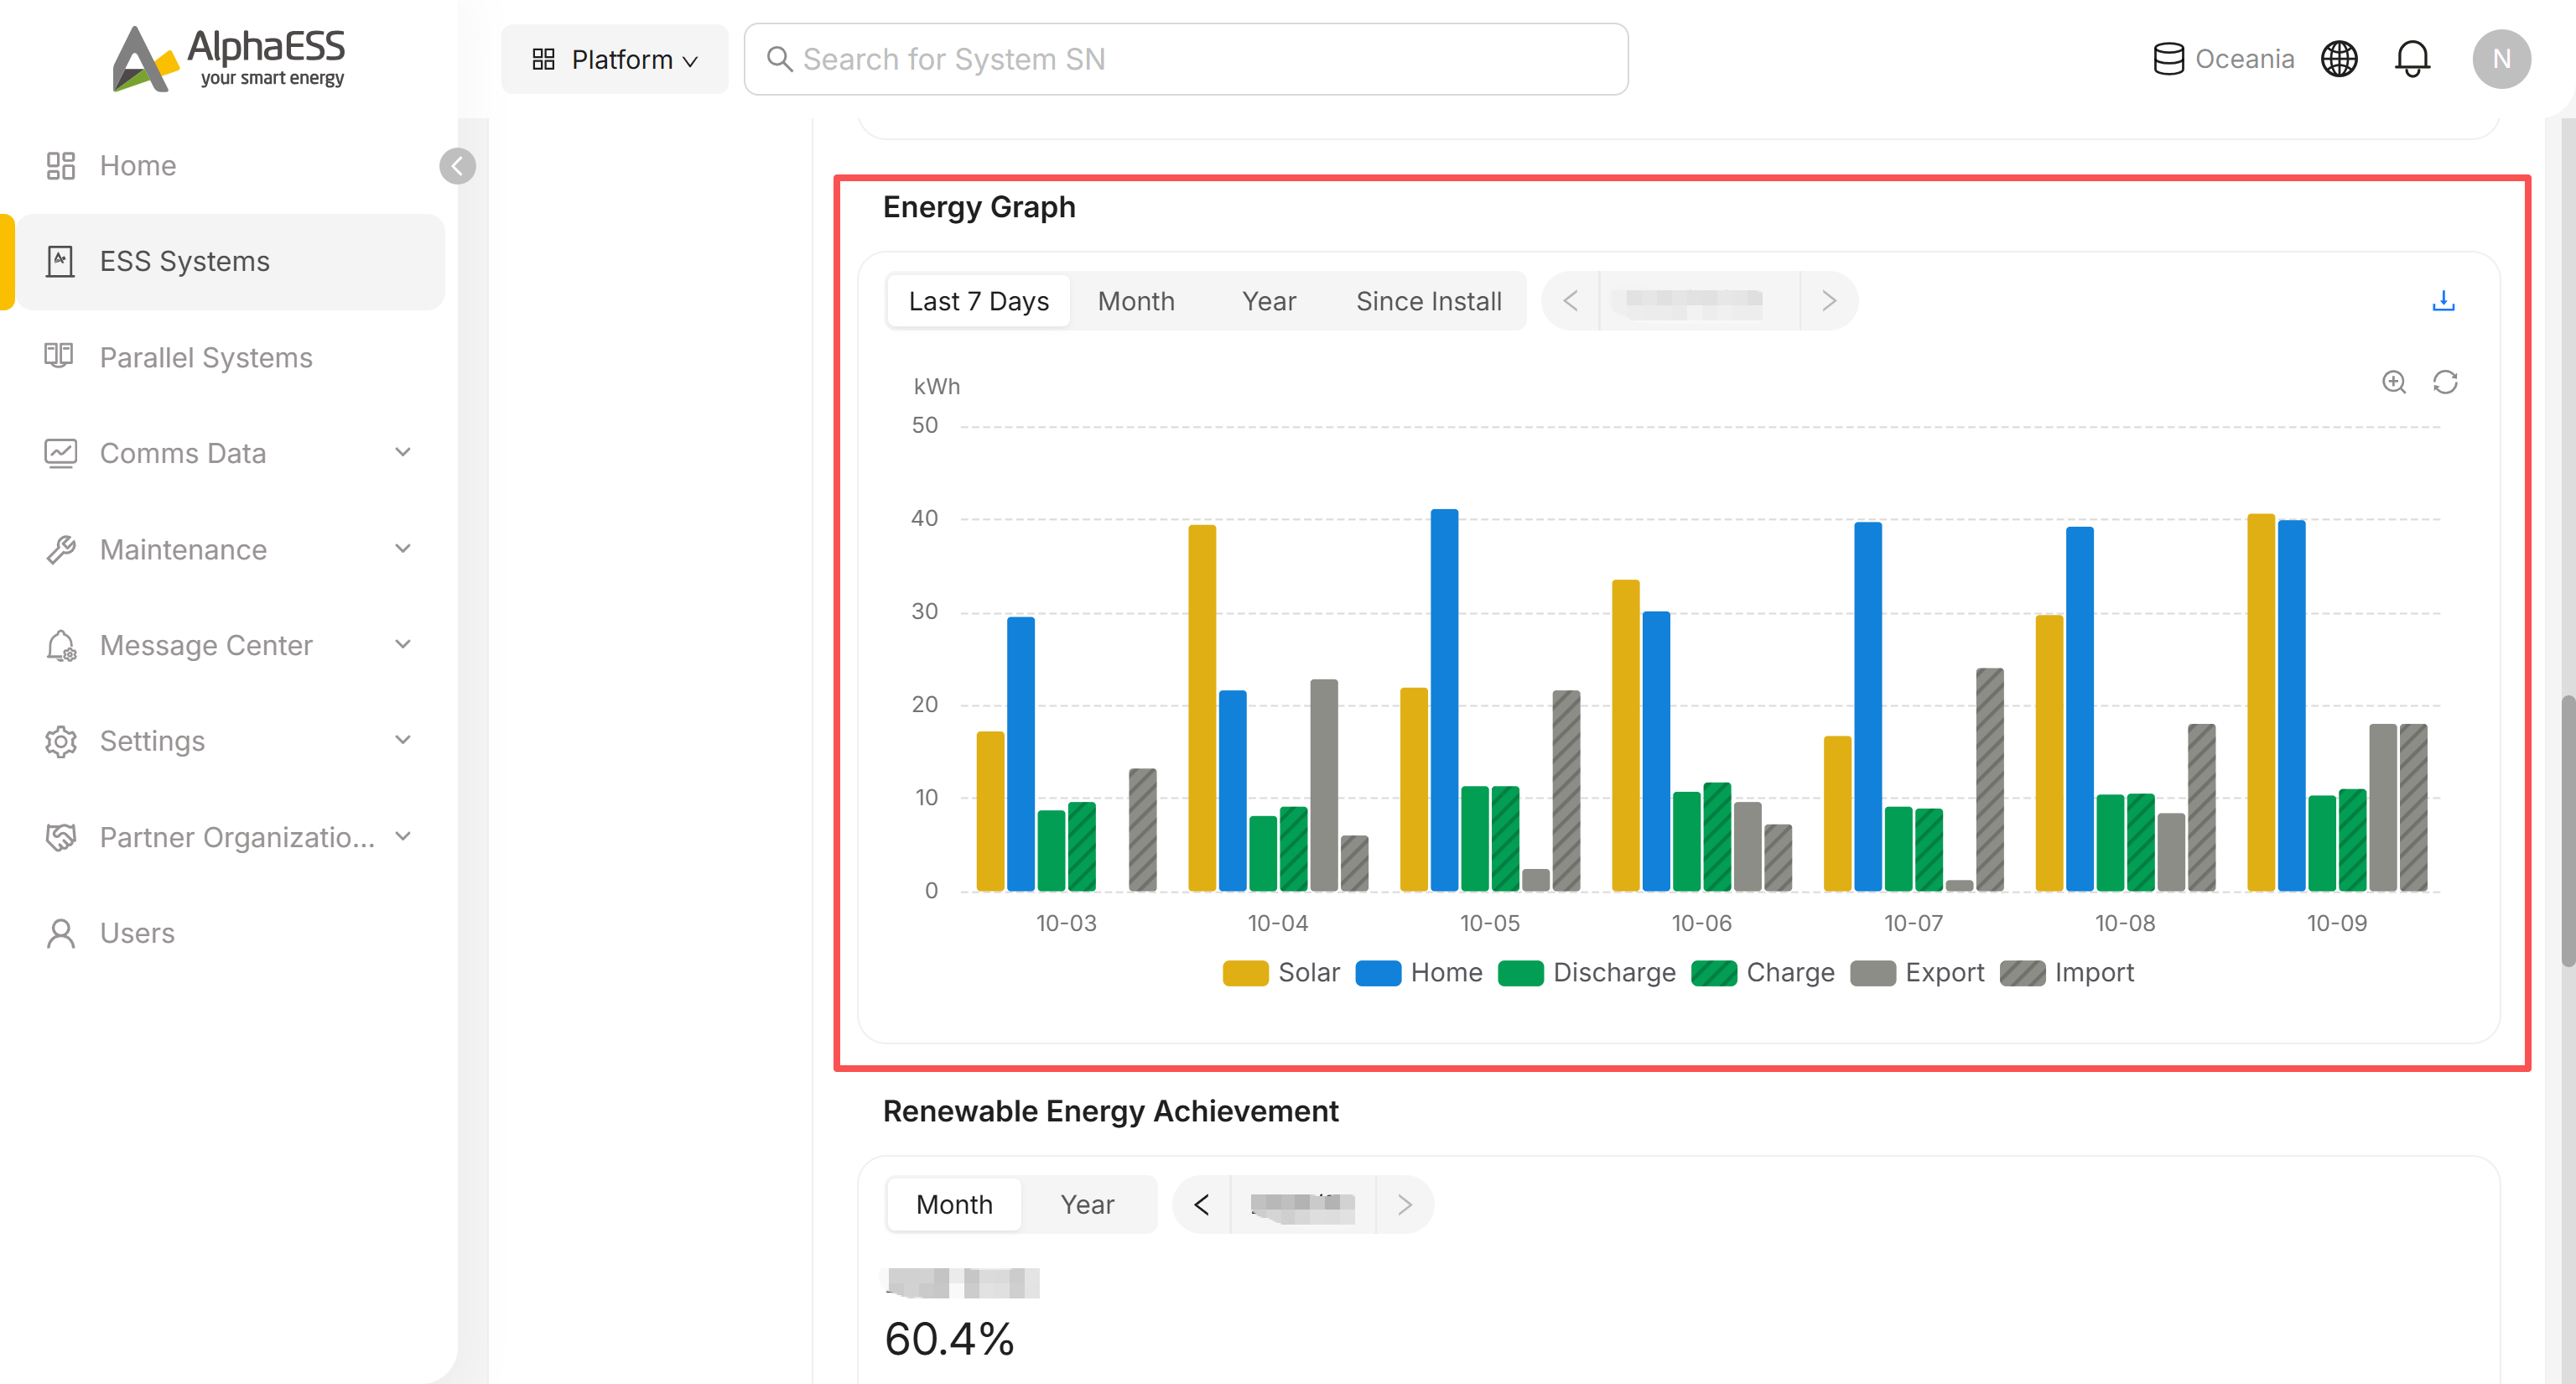
Energy Graph
An energy bar chart, selectable by Last 7 Days / Month / Year / Since Install, with a download icon plus zoom and refresh icons on the chart. The legend covers Solar / Home / Discharge / Charge / Export / Import.
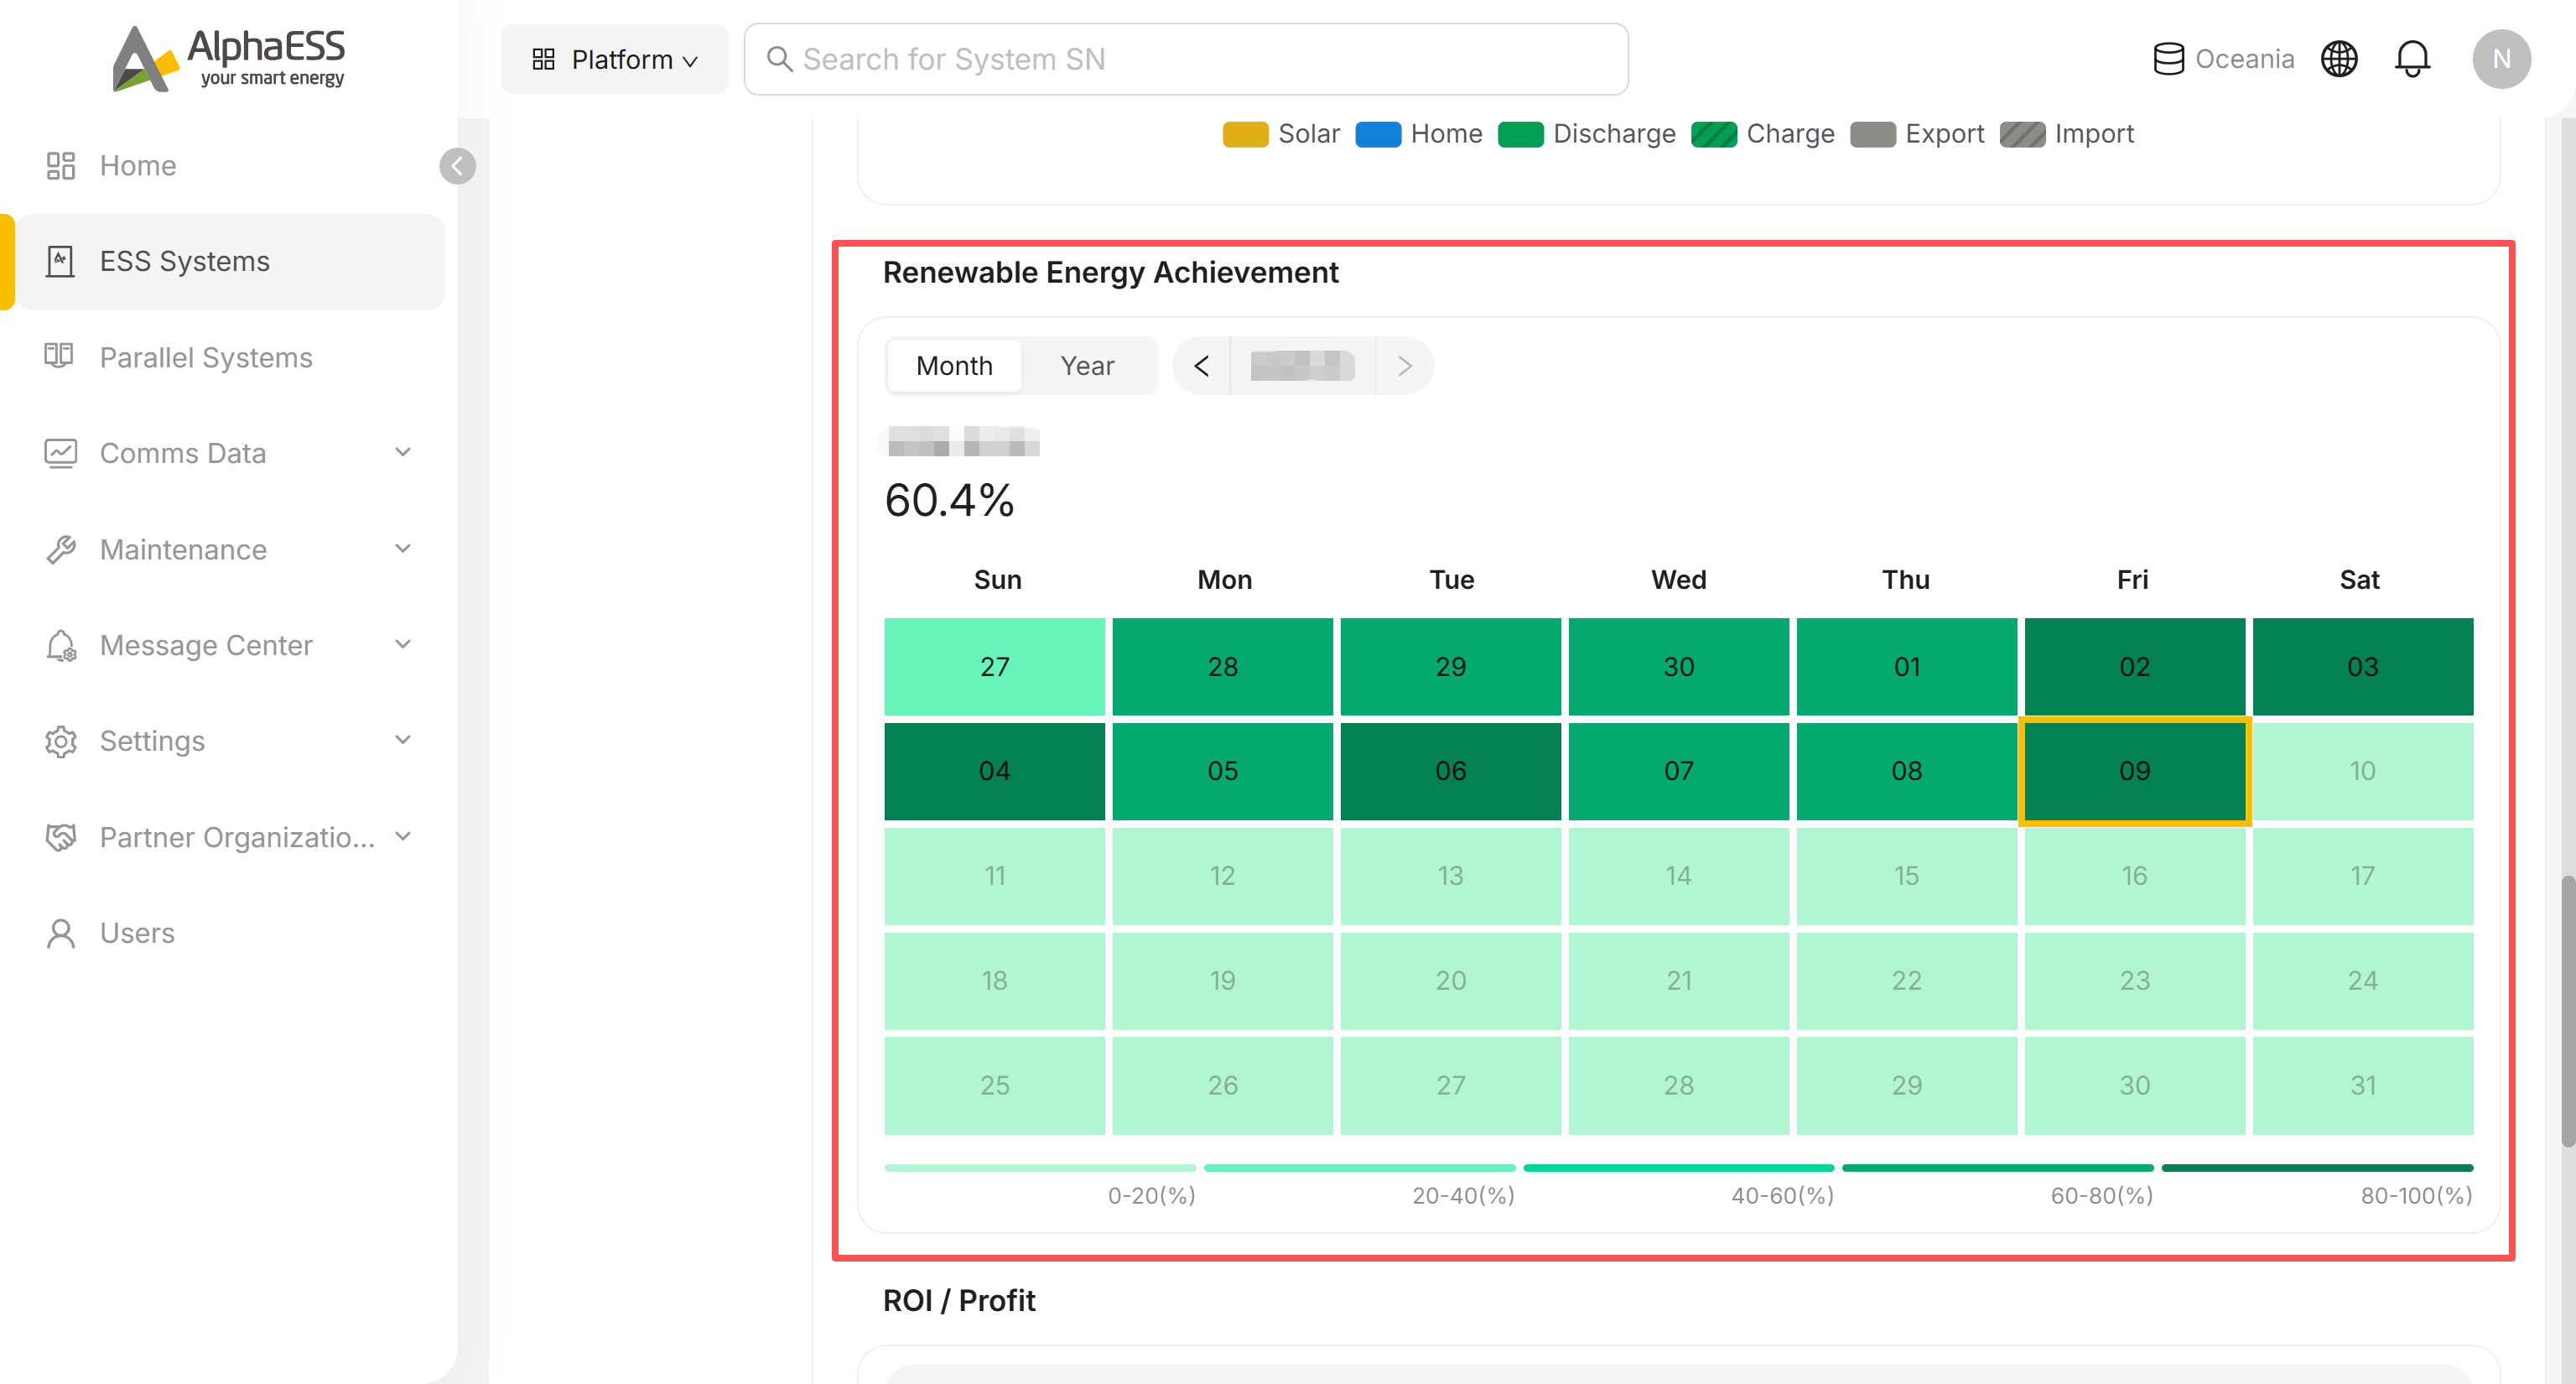
Renewable Energy Achievement
A calendar heatmap of the renewable-energy share by day, switchable between Month and Year. Each day's percentage is colour-coded against the legend: 0–20% / 20–40% / 40–60% / 60–80% / 80–100%.
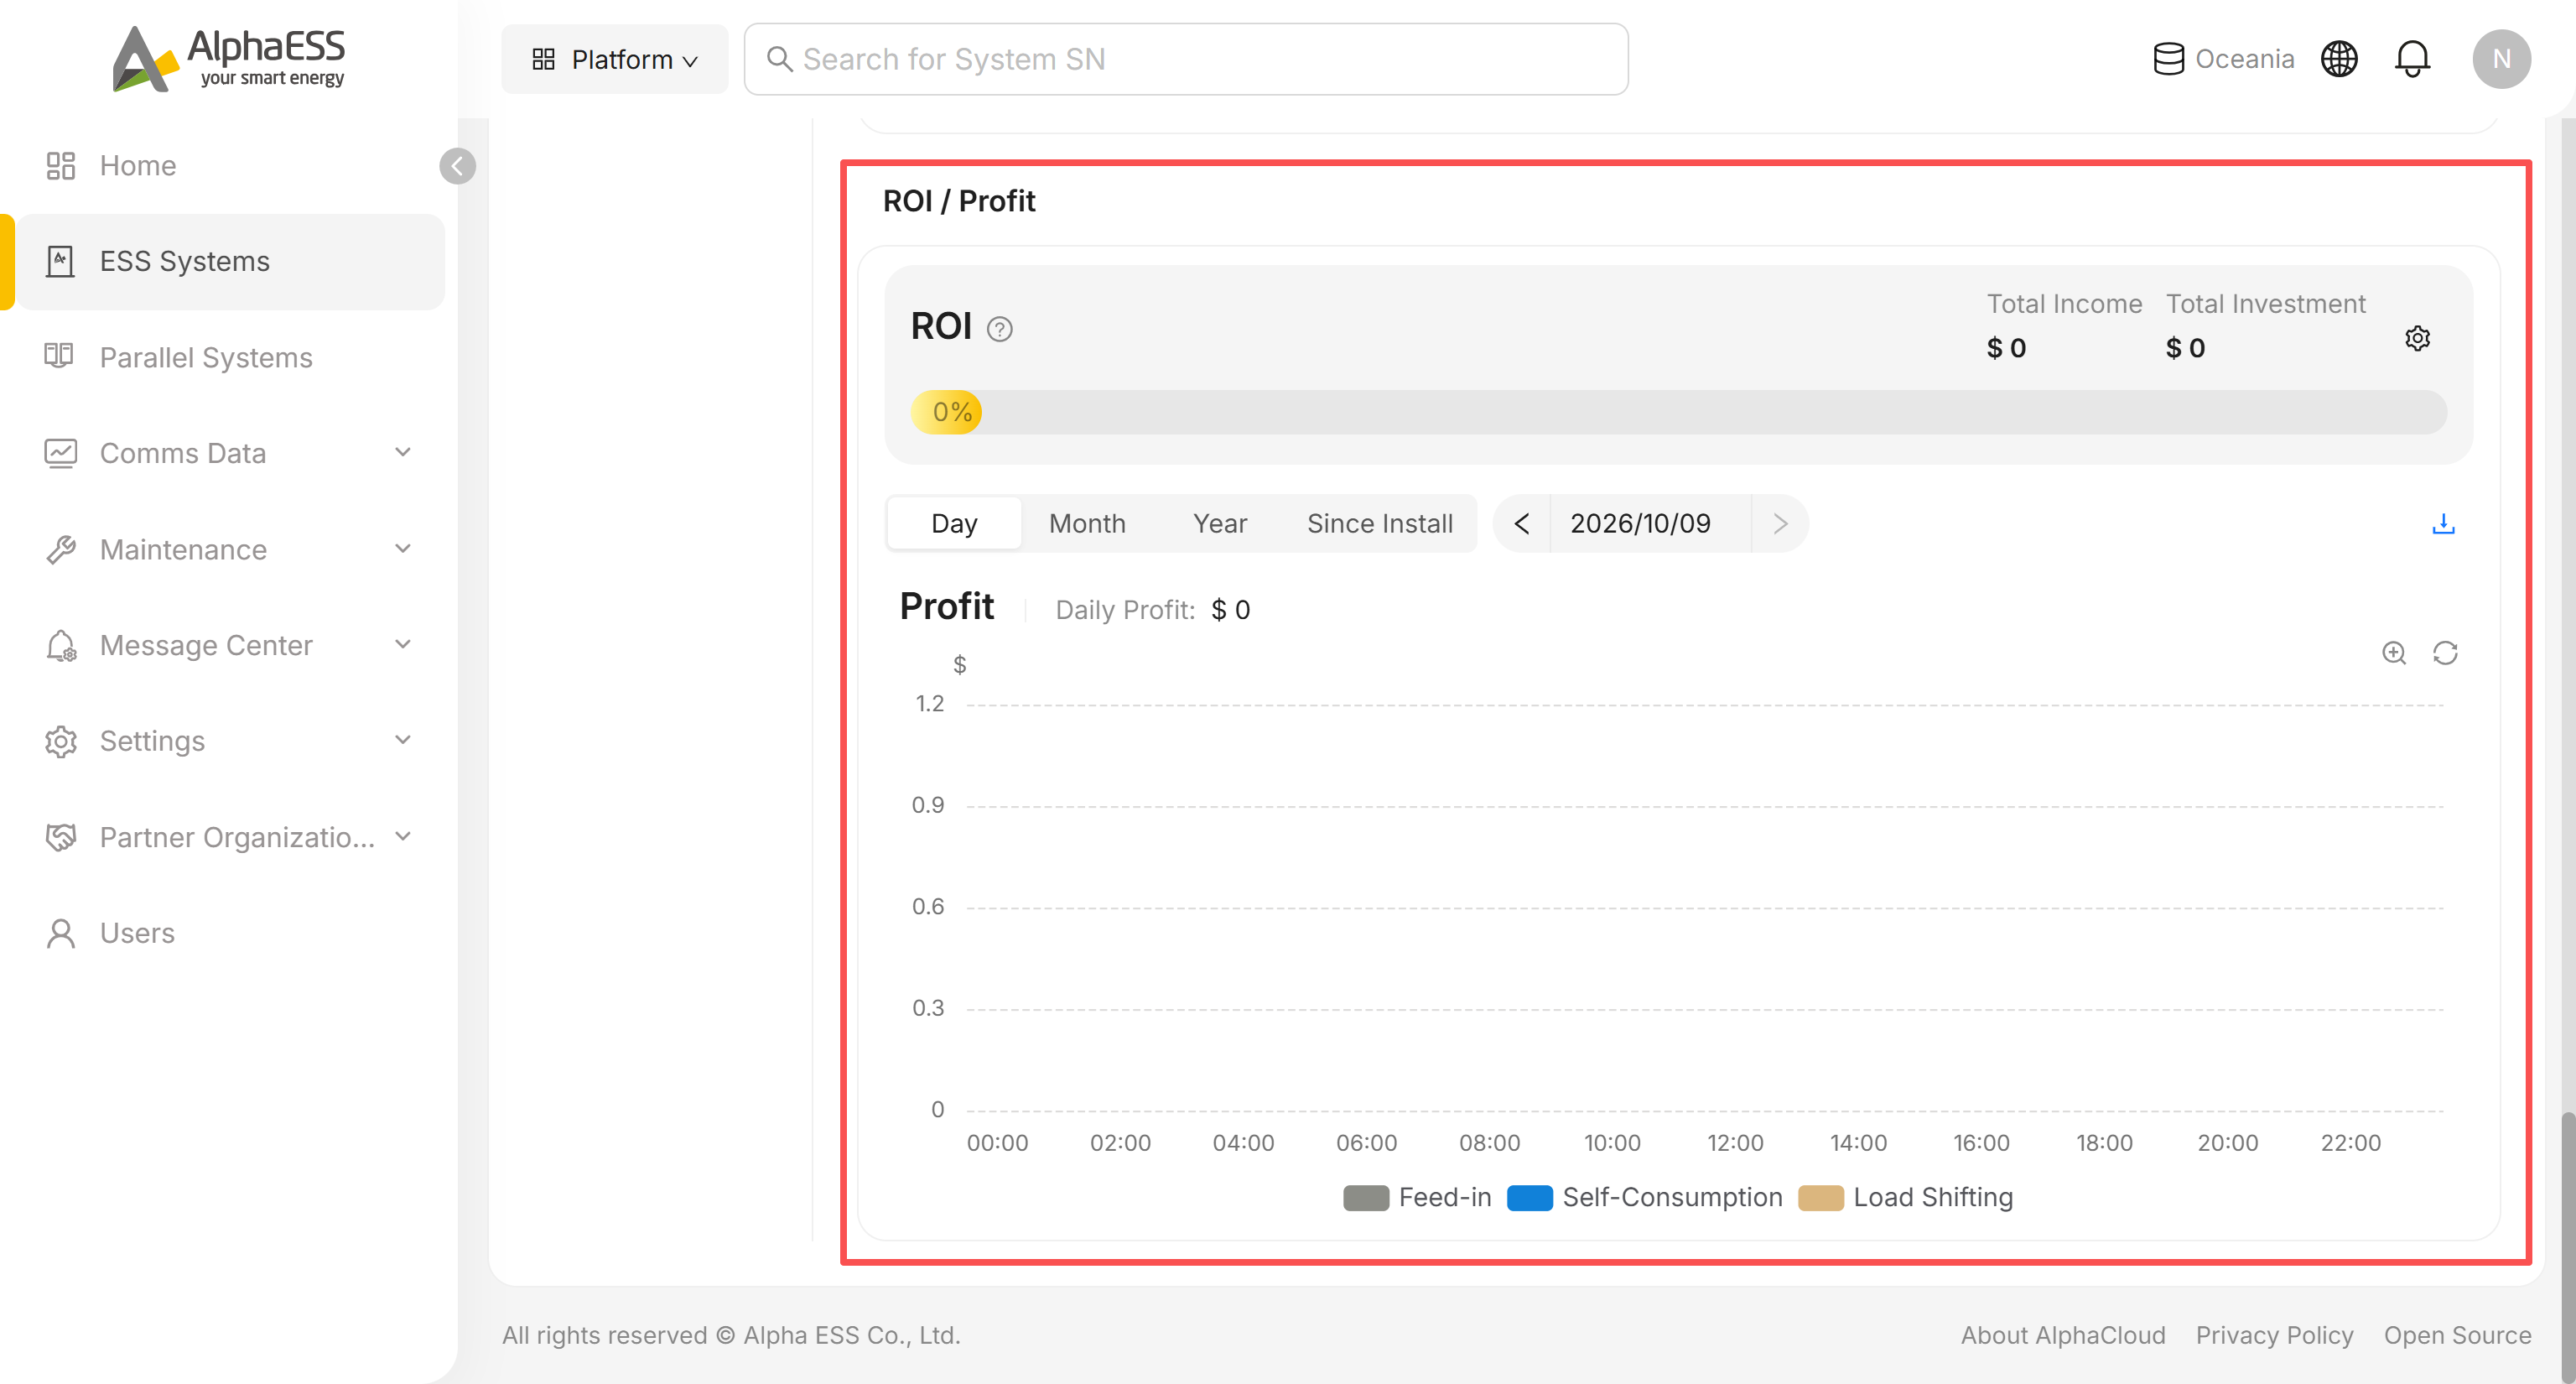
ROI / Profit
- ROI card: Total Income, Total Investment, a progress bar for the ROI percentage, an info icon (
?) explaining how ROI is calculated, and a settings icon for configuring the underlying parameters - Profit card: Day / Month / Year / Since Install switch, the profit chart, with download, zoom and refresh icons
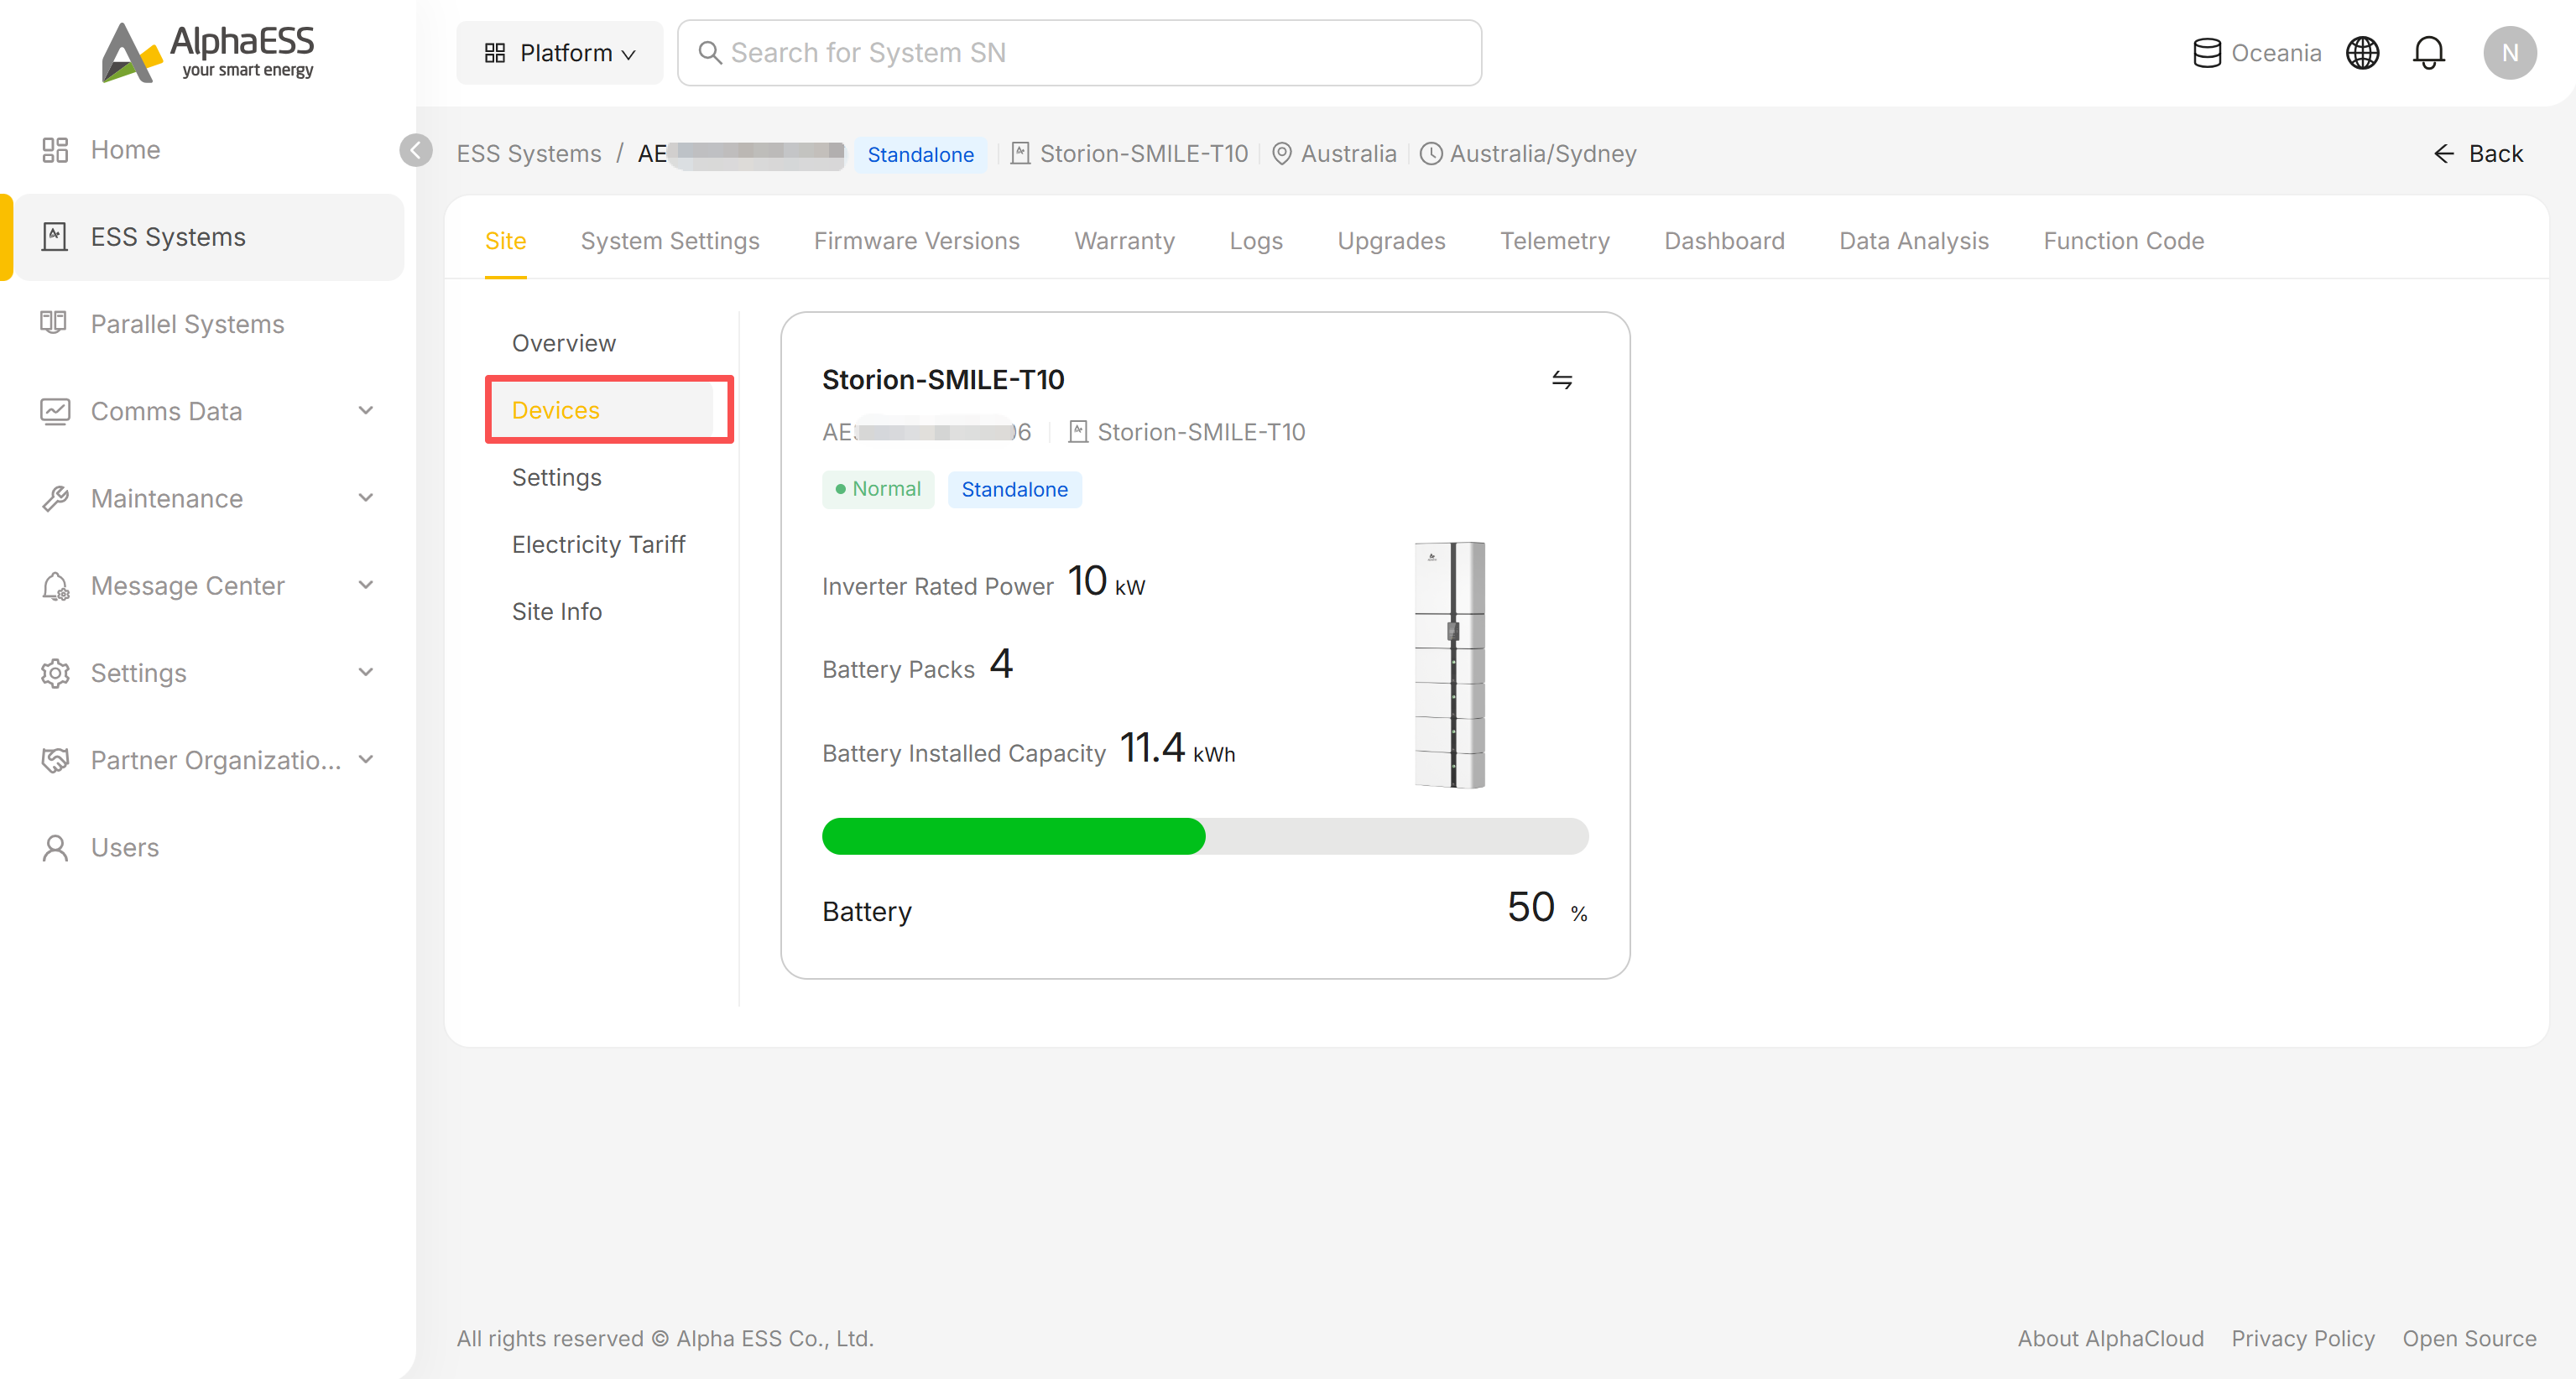
Site → Devices
Each device at the site has its own card:
- SN, model, status, operating mode, inverter rated power, number of battery packs, installed capacity and current SOC
Dashboard (live operating data)
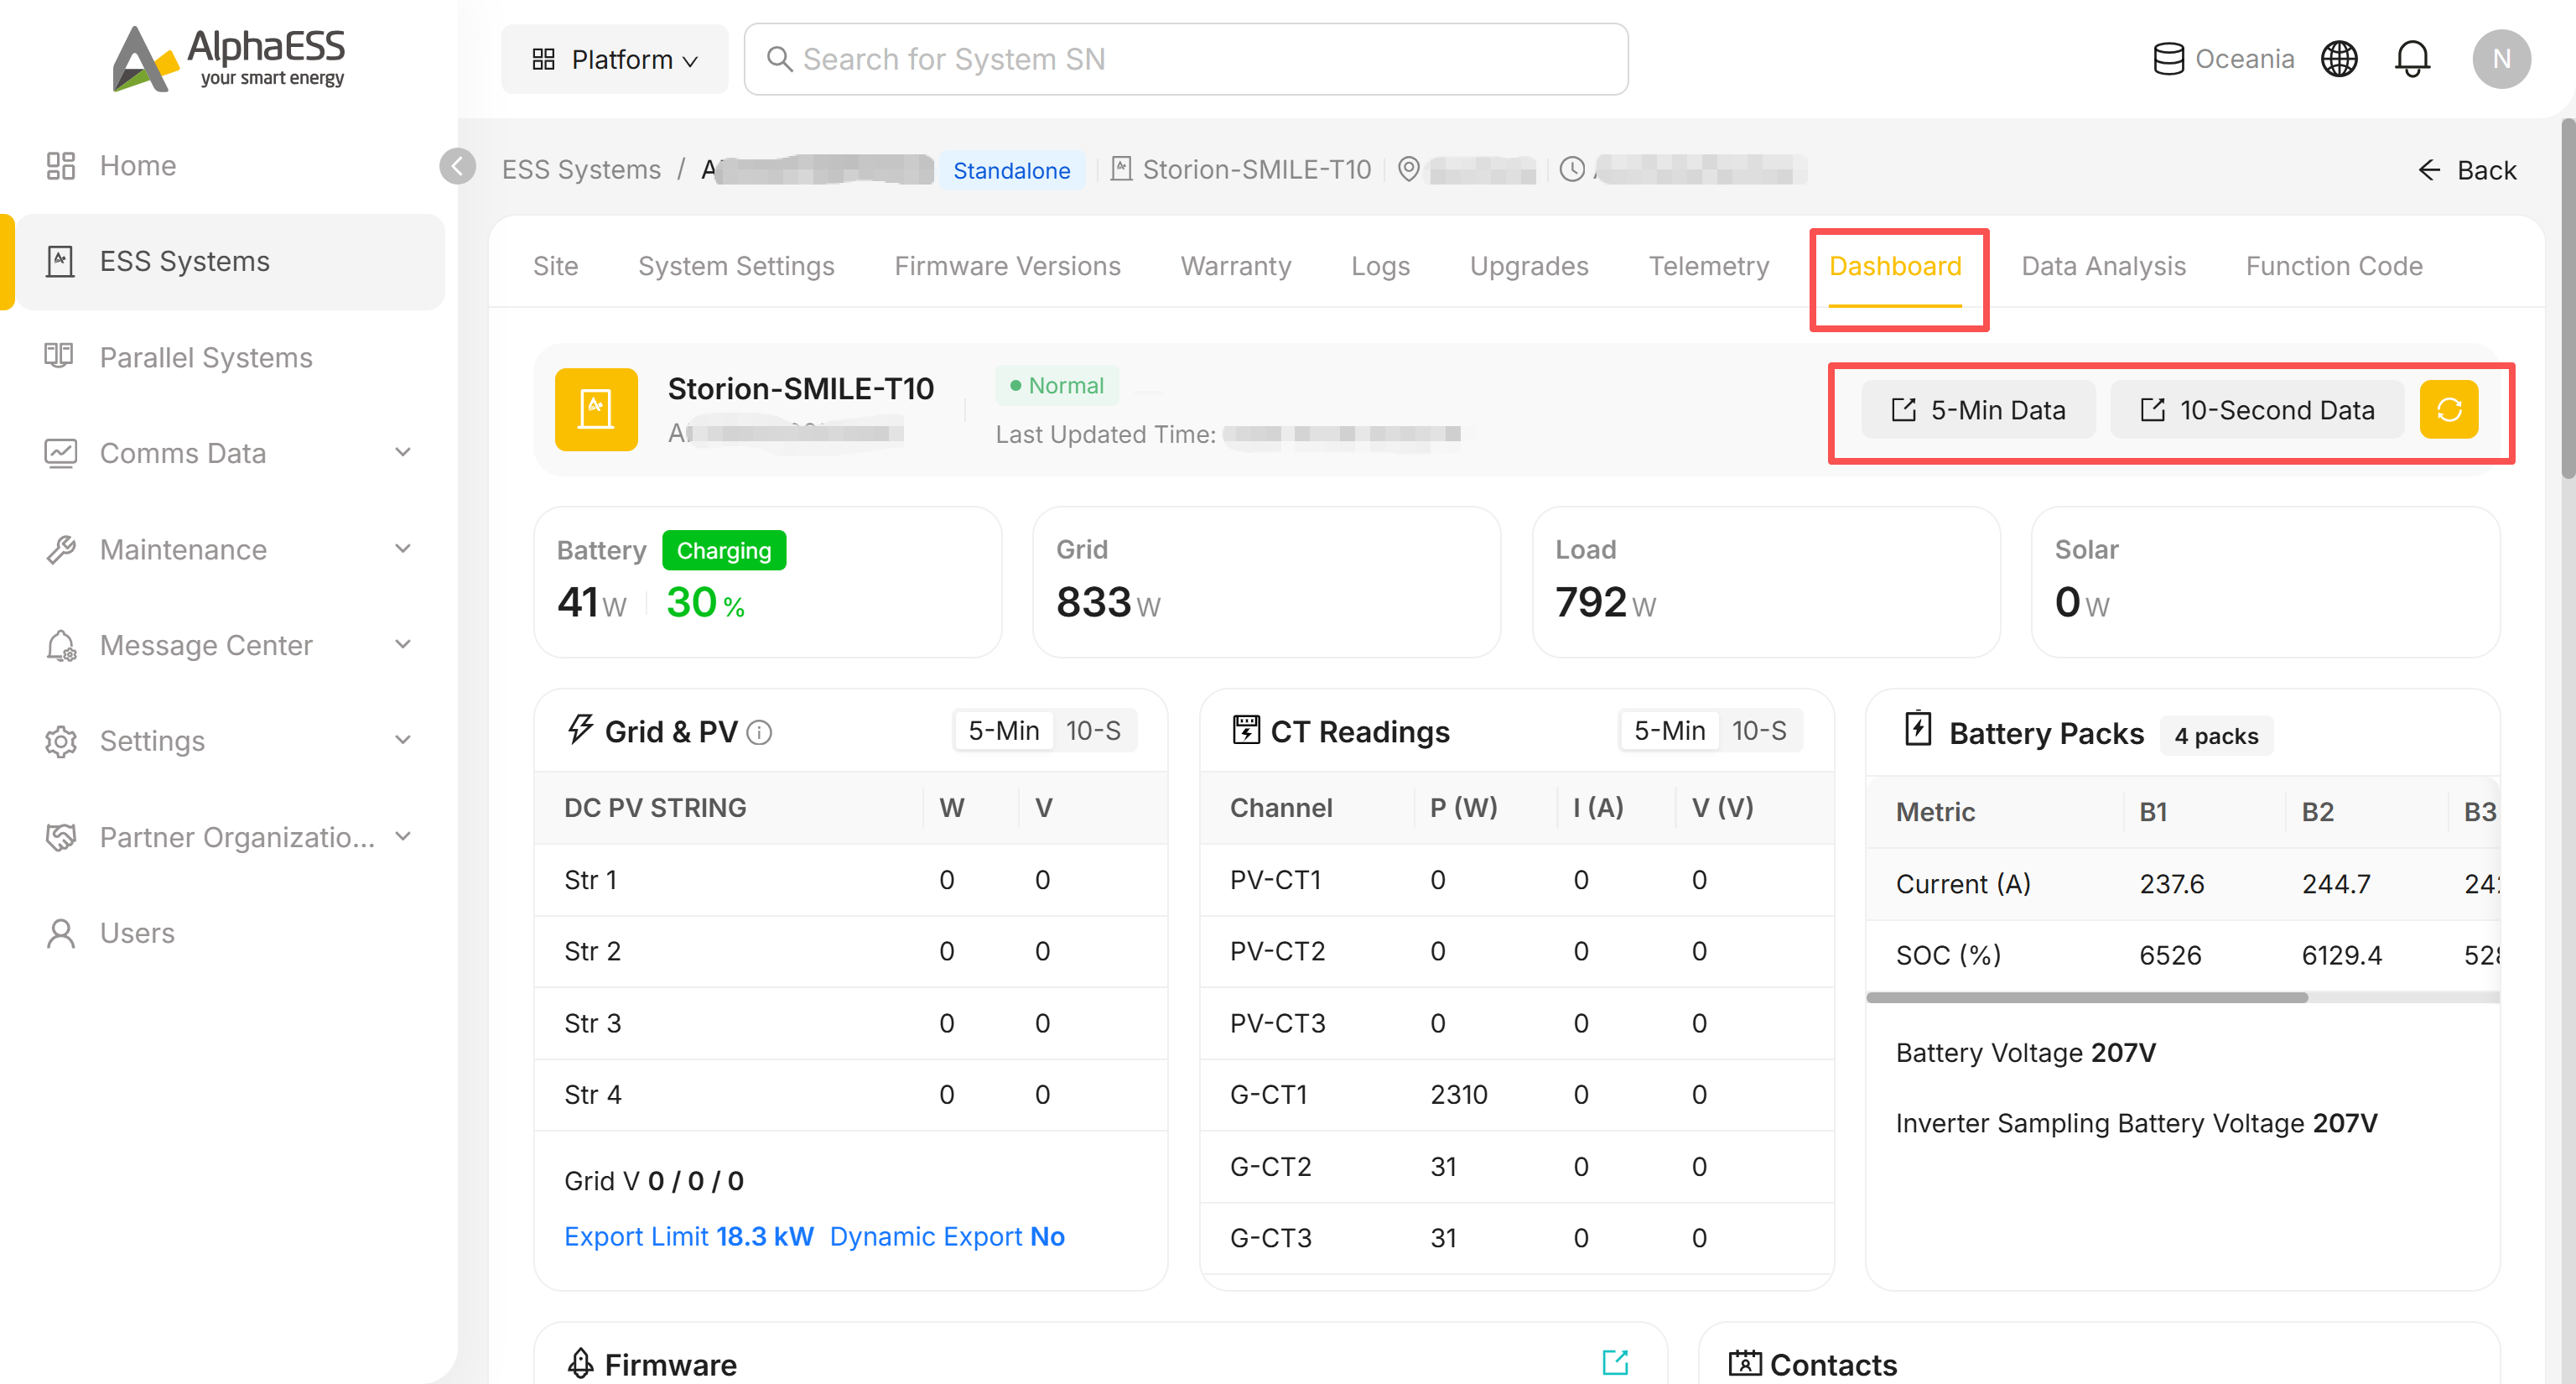
A real-time data panel for troubleshooting:
- Live Battery / Grid / Load / Solar power at the top
- Grid & PV: voltage and current for each DC PV STRING, plus Grid V, Export Limit and Dynamic Export
- CT Readings: power / current / voltage for the PV-CT and G-CT channels
- Battery Packs: current and SOC for each battery pack (the panel title shows the number of packs, e.g. "4 packs")
Both Grid & PV and CT Readings can be switched between 5-Min and 10-S granularity.
At the top of the page, 5-Min Data and 10-Second Data are shortcuts that jump to the matching sub-tab under Telemetry (the raw time-series data table) — see 3.3 Maintenance and Troubleshooting.
💡 Inspection tip: start each day from the Running State on the Home page — whenever the Fault / Offline figures are non-zero, click through to the corresponding list and work through the devices one by one (see 3.3 Maintenance and Troubleshooting).