

Power and Energy Graphs
The Home page charts answer the question every owner asks: what did my system actually do? This page explains each chart and how to export the underlying data.
Power Graph
The first chart on the Home page plots power (W) through the day — solar generation, household load, battery charge/discharge and grid exchange — with the battery state of charge (%) on the right-hand axis. Use the arrows to step back through previous days, and the download icon to save the chart.
Energy Balance
The Energy Balance shows where your energy came from and where it went for a chosen period — sources (Solar, grid Import, battery Discharge) on the left, destinations (Home, battery Charge, grid Export) on the right, with the flows drawn between them.
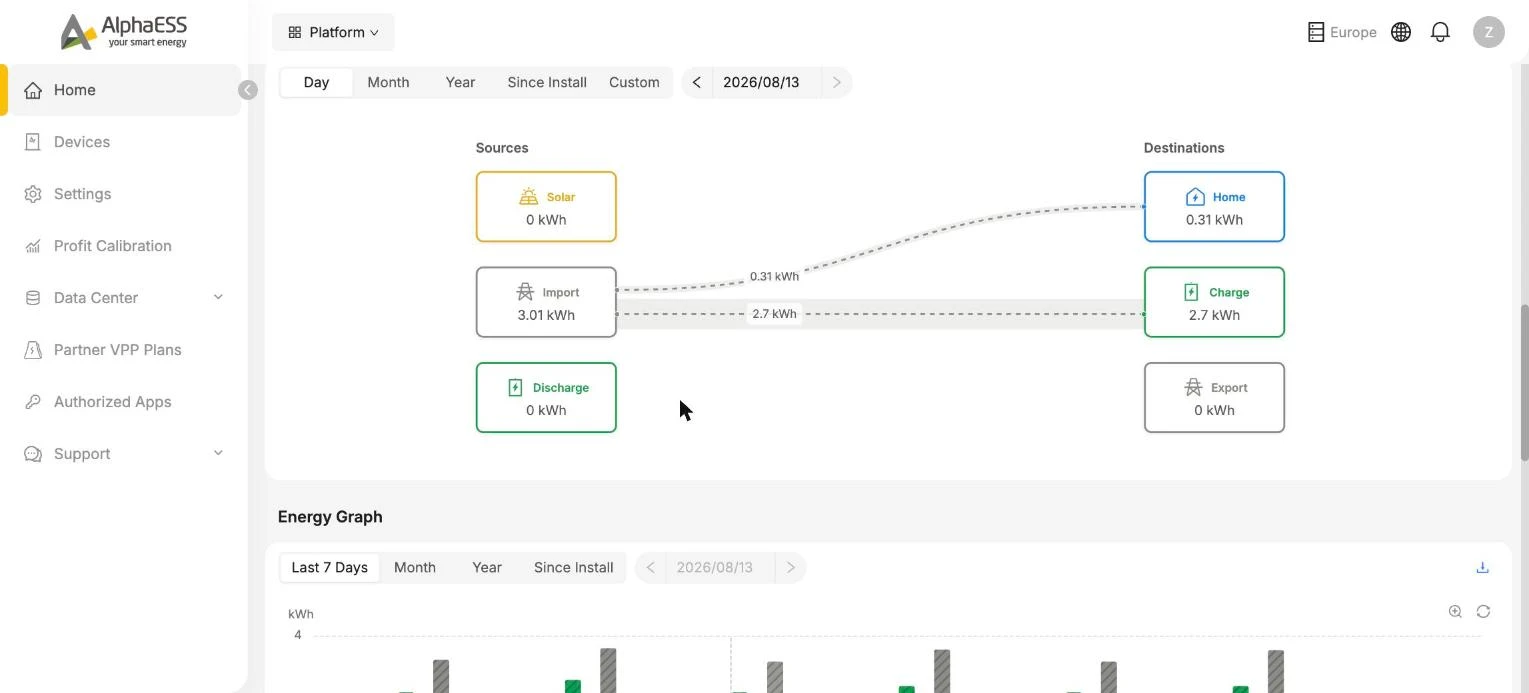
Switch the period with the tabs: Day / Month / Year / Since Install / Custom.
💡 A quick health check: on a sunny day most of your solar energy should flow to Home and Charge rather than Export — that is self-consumption working as intended.
Energy Graph
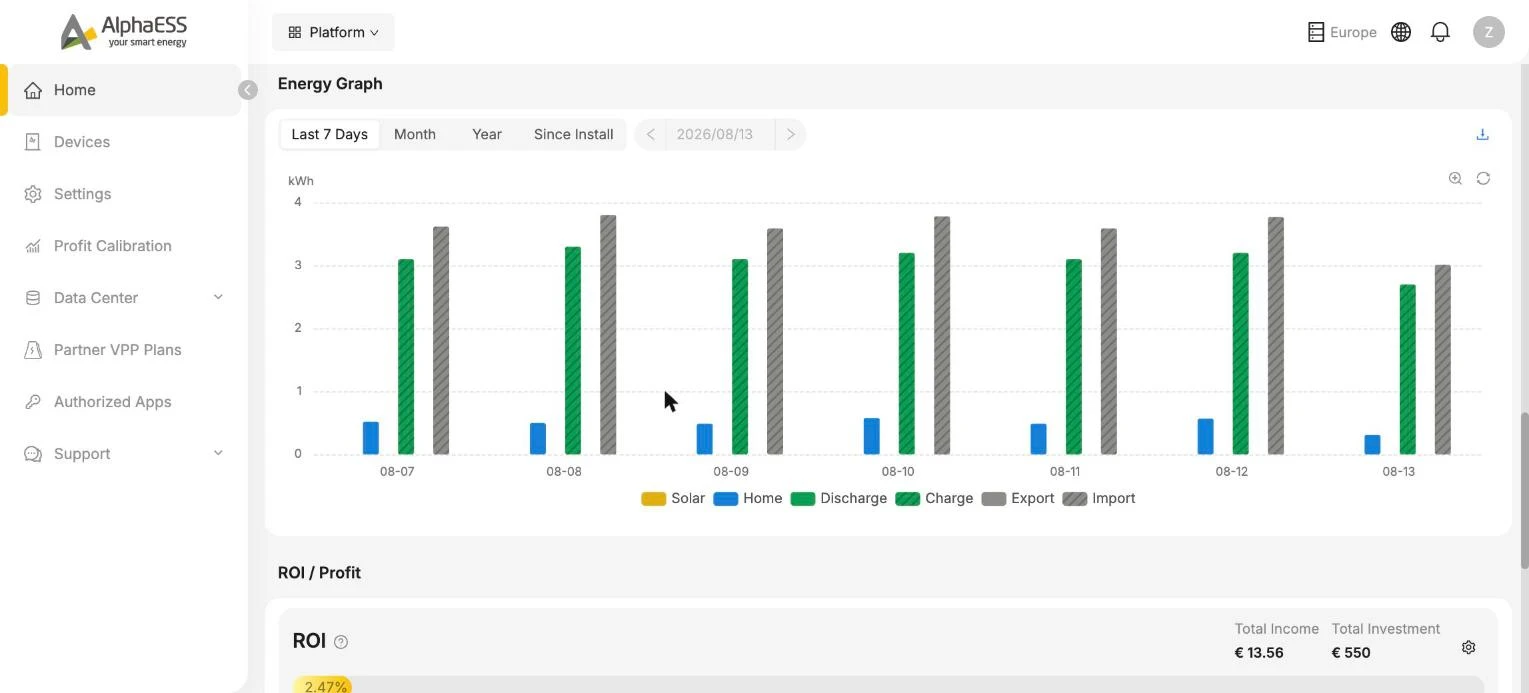
The Energy Graph turns the same data into daily bars so you can compare days at a glance — Solar, Home, battery Discharge/Charge and grid Export/Import for Last 7 Days / Month / Year / Since Install.
Exporting your data
For spreadsheets or your own analysis, use Data Center → Power Data Export:
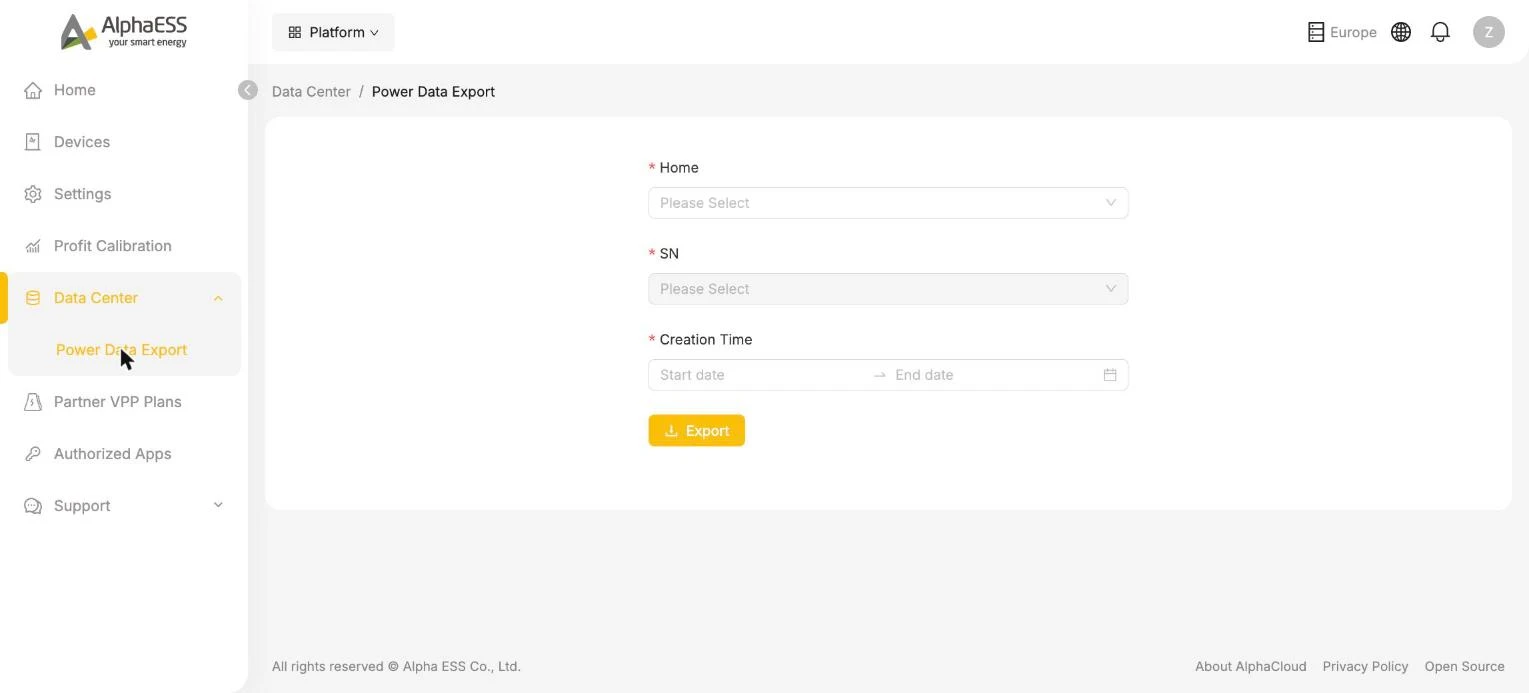
- Select the Home, the device SN and the time range
- Click Export to download the power data
💡 Each chart also has a small download icon in its corner for a quick one-off export of what you see.