Energy Data
What is the difference between kW and kWh
These are two units that are easily confused but mean different things:
- kW - power: the rate at which electricity flows at a given moment, that is, how quickly a device is generating, consuming, charging or discharging. The value changes in real time with the state of the system and describes the "current status".
- kWh - energy: the electrical energy generated or consumed over a period of time. Running continuously at a power of 1 kW for 1 hour equals 1 kWh. It describes the "cumulative total".
In short, kW reflects instantaneous power, whilst kWh reflects cumulative energy. That is why the real-time figures in the energy flow diagram on the home page are shown in kW, whilst historical energy statistics and electricity billing are shown in kWh.
Real-time power overview
The home page shows your home's energy status at this moment. In the home energy flow diagram, you can see:
- PV generation power (kW): how much solar power is currently being generated
- Battery status: shows the battery's charge/discharge power (kW), current battery level (SoC, %) and operating status (charging, discharging or standby)
- Home load power (kW): the electricity your home is consuming
- Grid power (kW): shows whether you are currently importing from the grid or feeding into the grid
- EV Charger power (kW): shown only when an EV Charger is connected to the system
The direction of the energy flows shows where energy is going between the various devices, helping you quickly understand how energy is being used right now.
Historical energy data
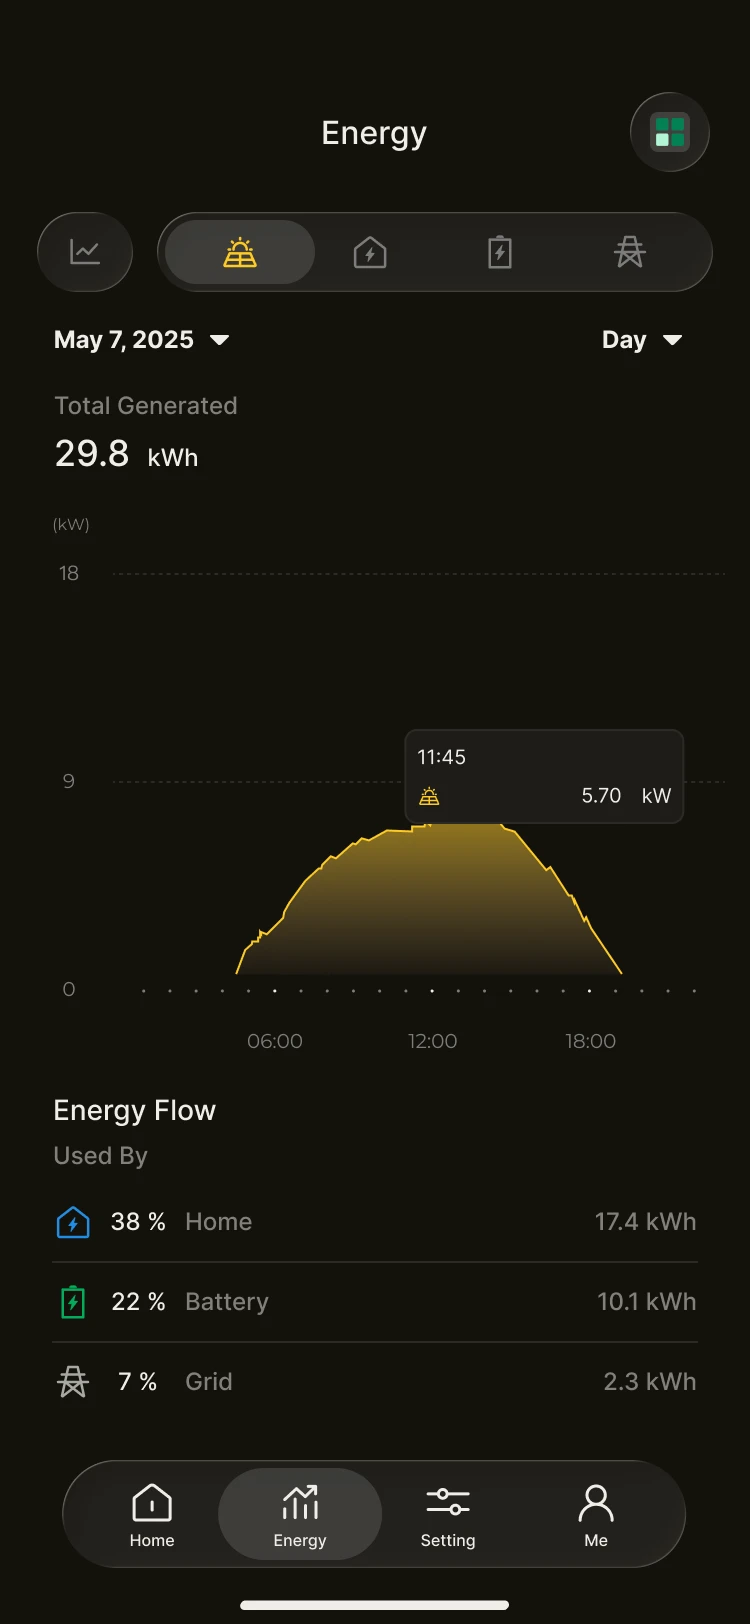
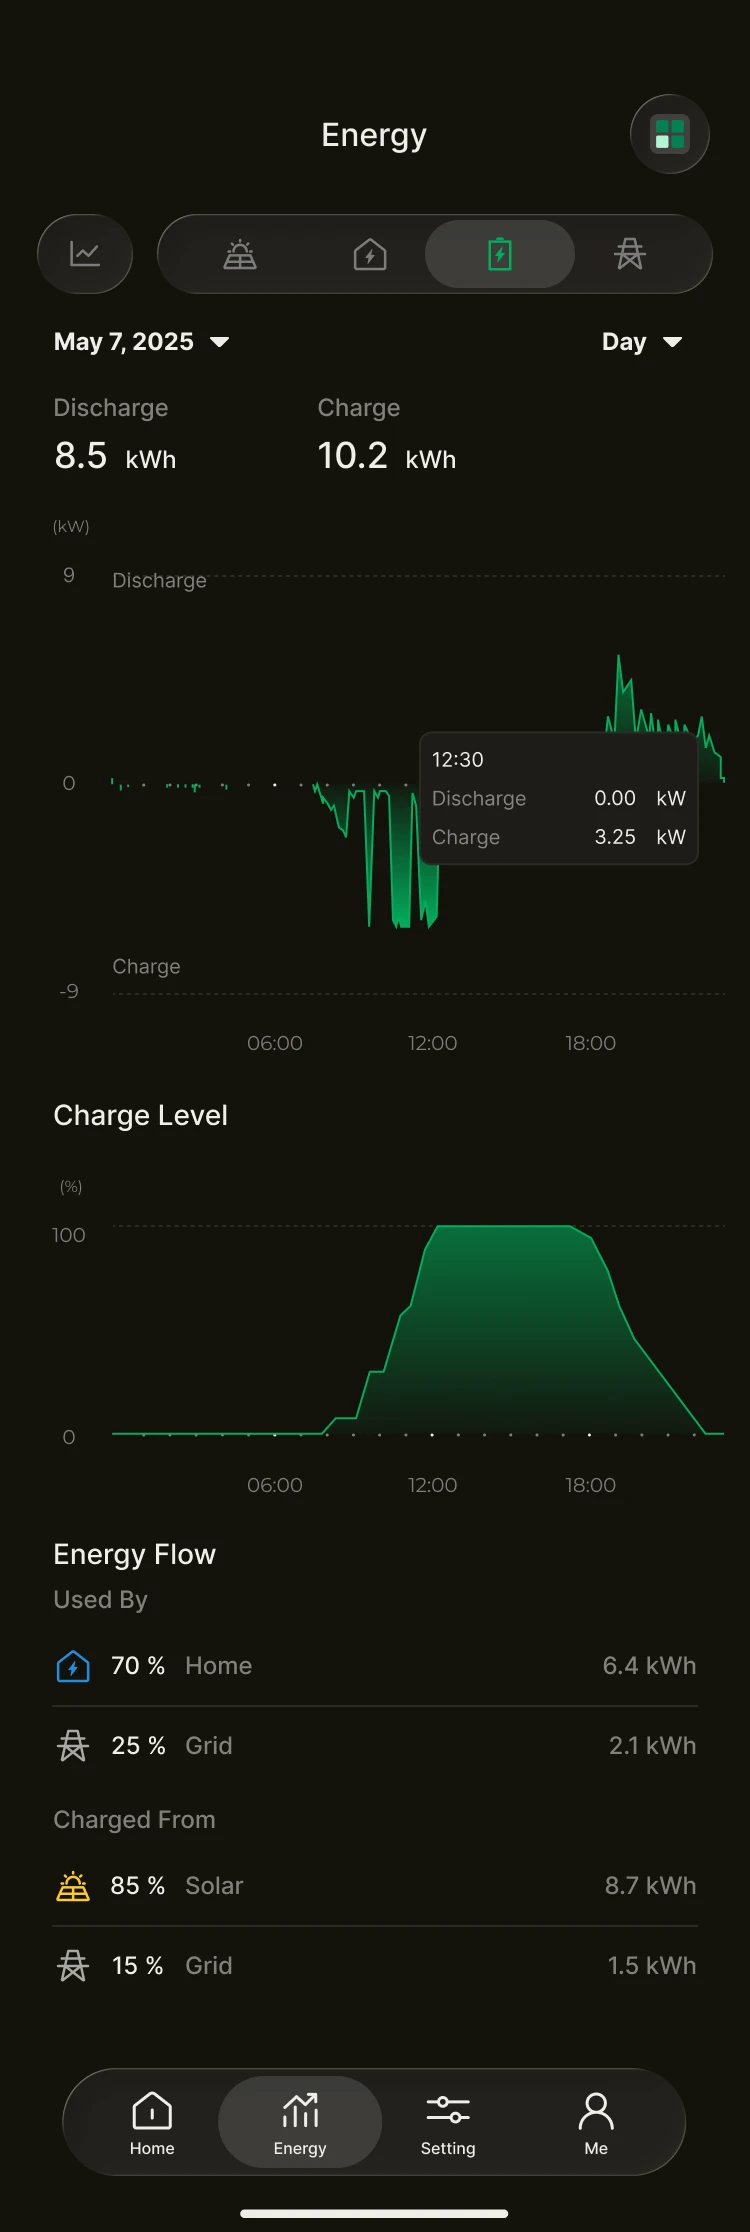
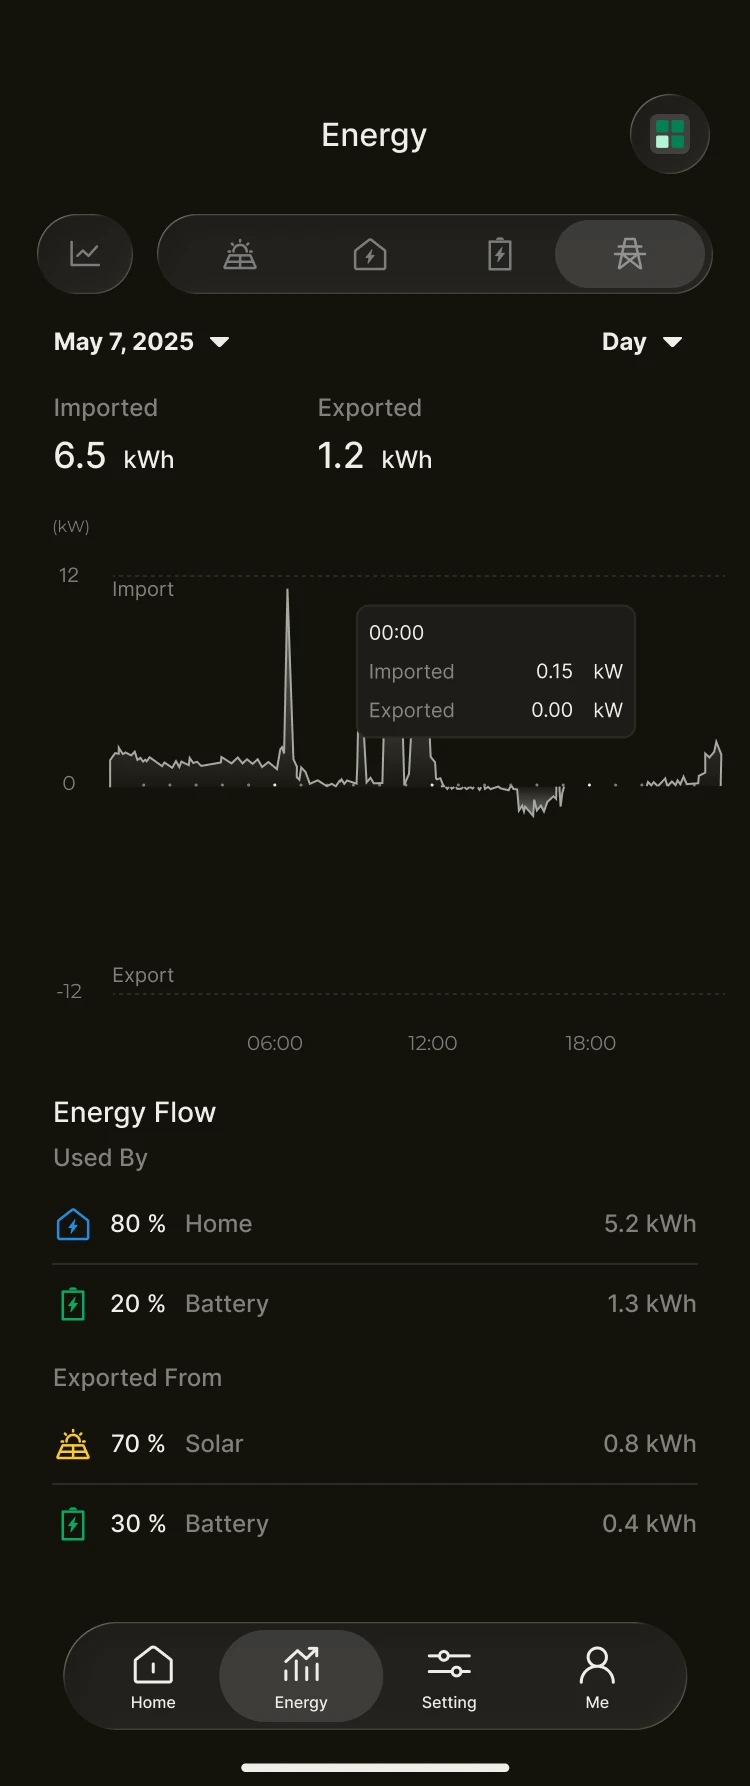
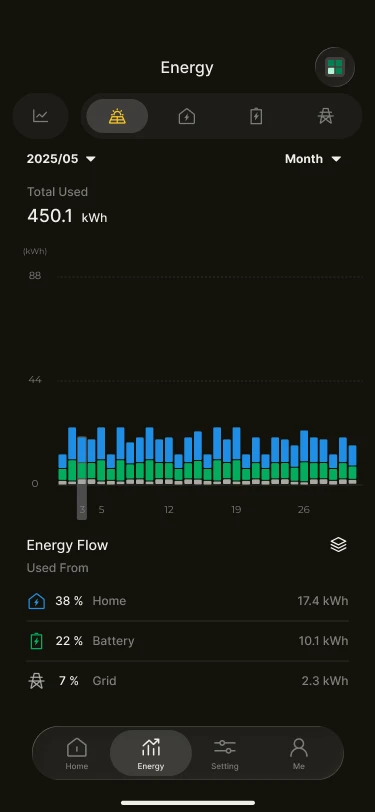
On the Energy page, you can review your home's generation and consumption over different time scales. You can view:
- PV generation
- Battery charge and discharge energy
- Home consumption
- Grid import and feed-in energy
This data helps you understand your household's energy habits and how the system performs over different periods.
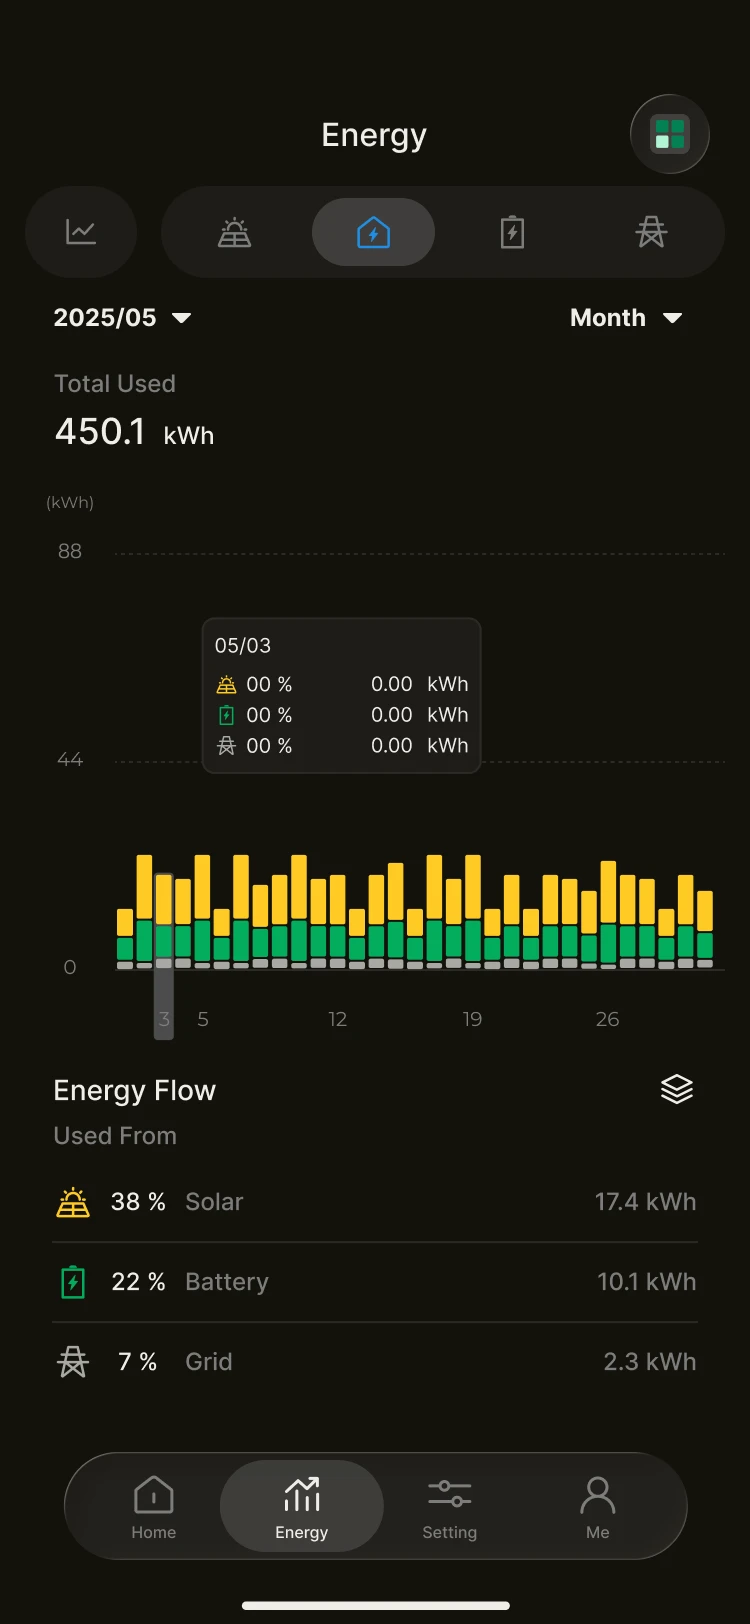
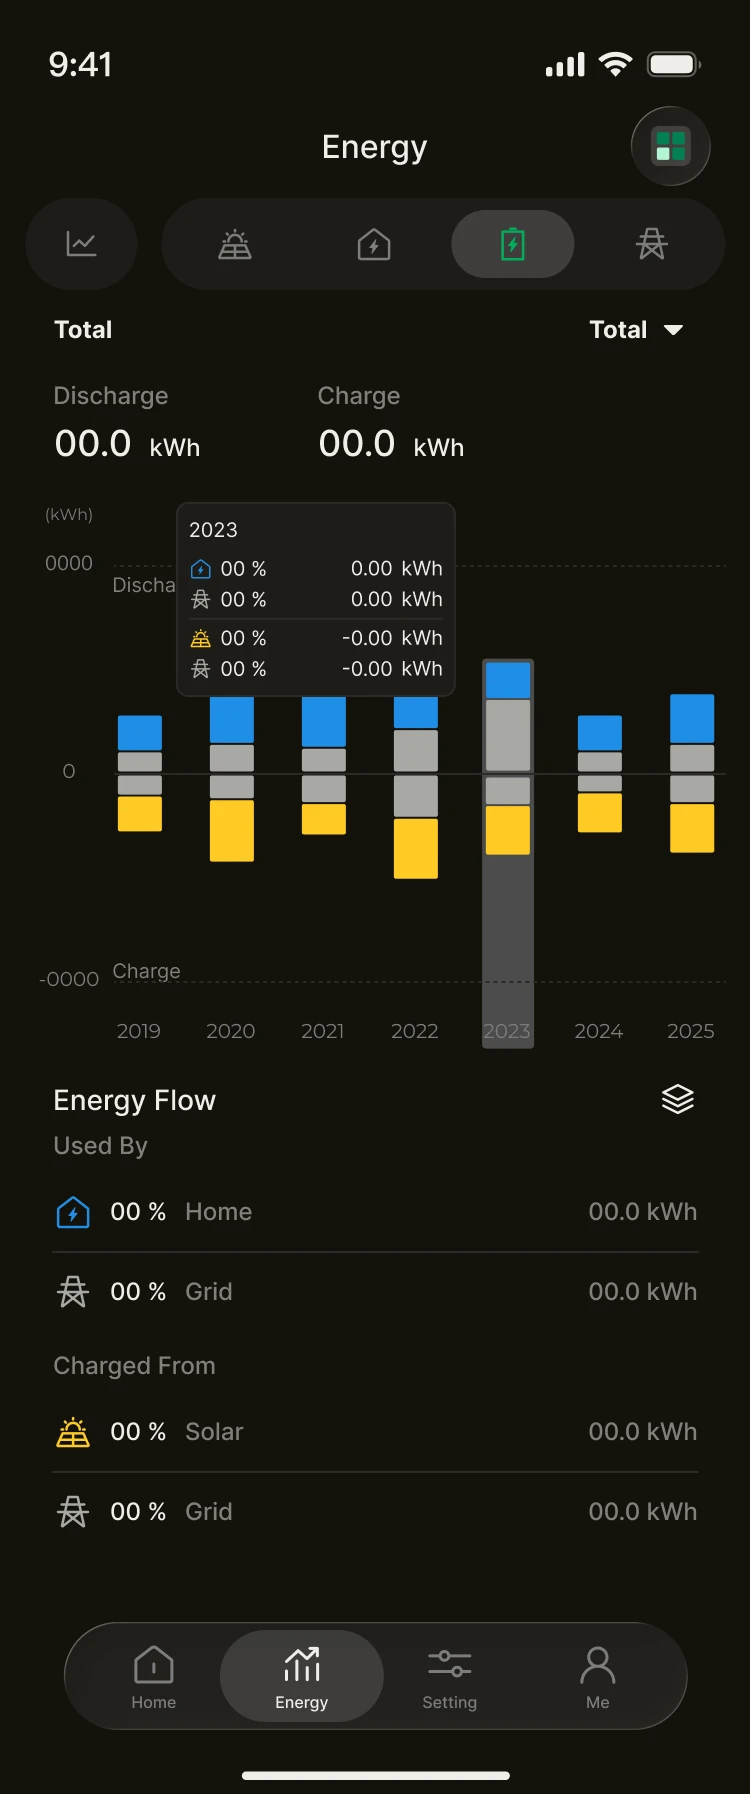
How to read the energy charts
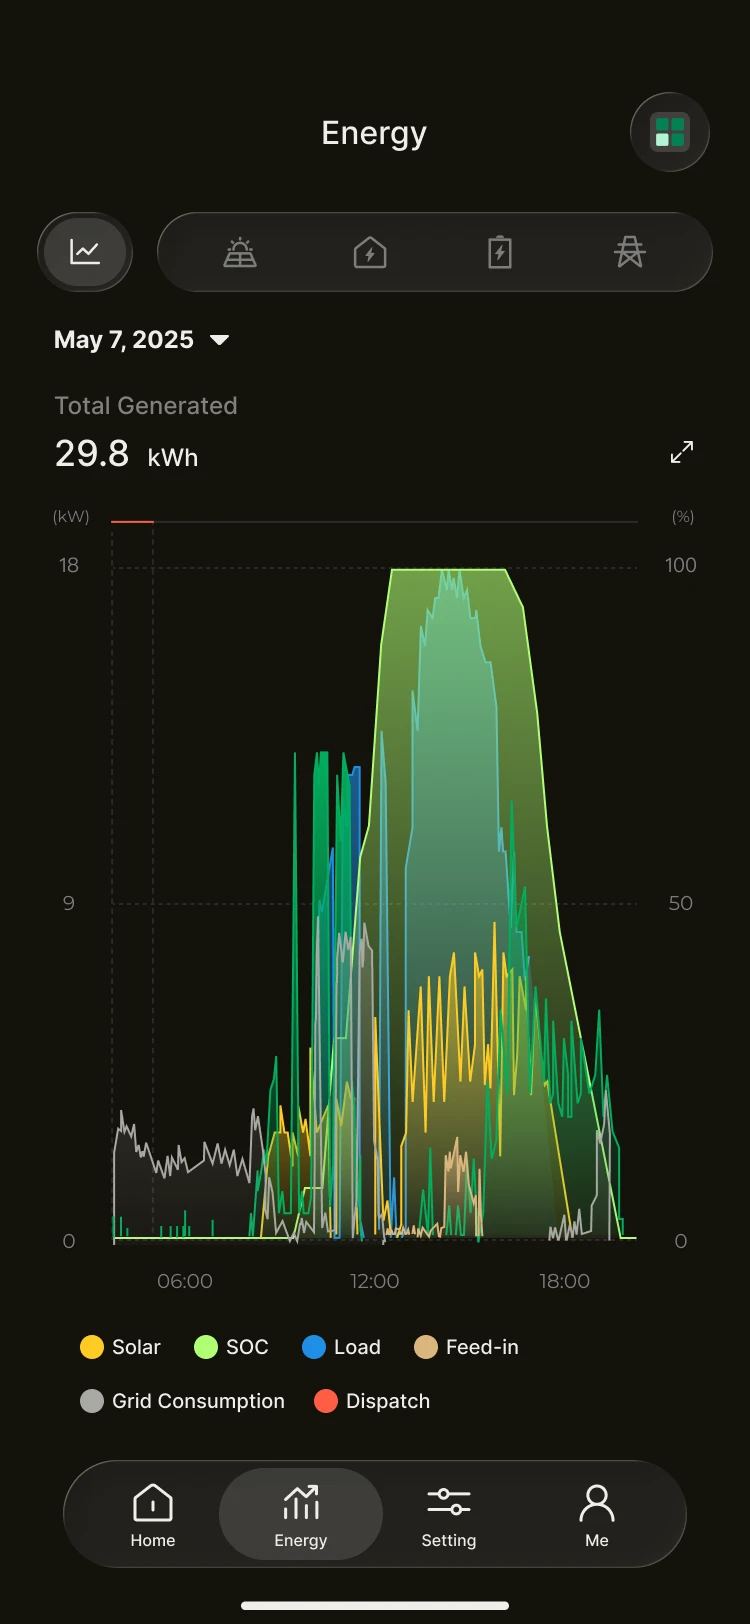
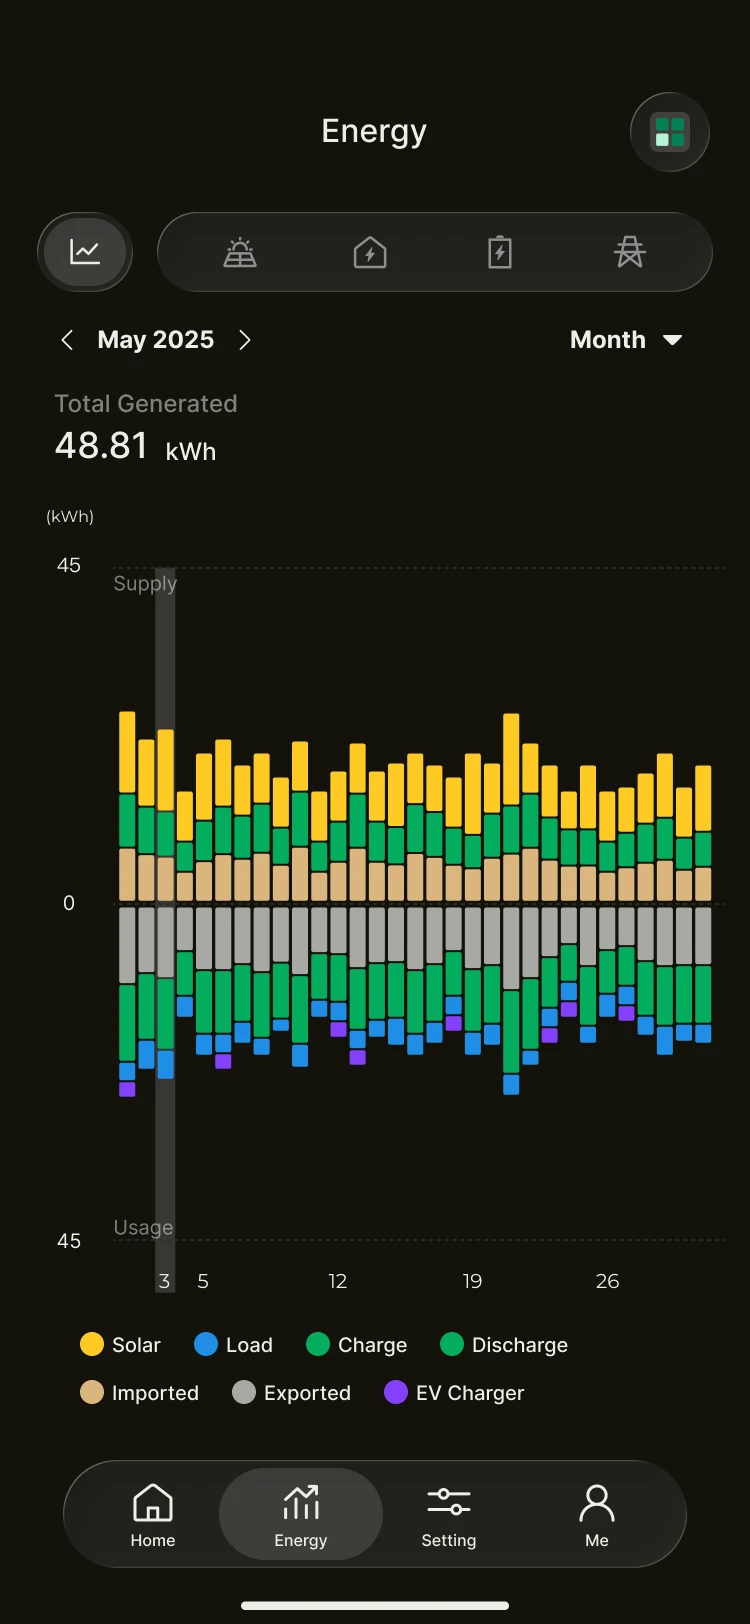
The energy charts are designed to show trends in how energy changes, rather than instantaneous values.
- During the day, power usually comes mainly from solar
- At night, your home relies more on the battery or the grid
Tap the Stacked View button at the bottom of the chart and the energy chart will use different colours to distinguish where energy comes from and where it goes, giving you a clear view of your home's energy mix in each period. For example: on overcast or rainy days more of your home's electricity comes from the battery or the grid, whilst on sunny days it usually comes mainly from solar.
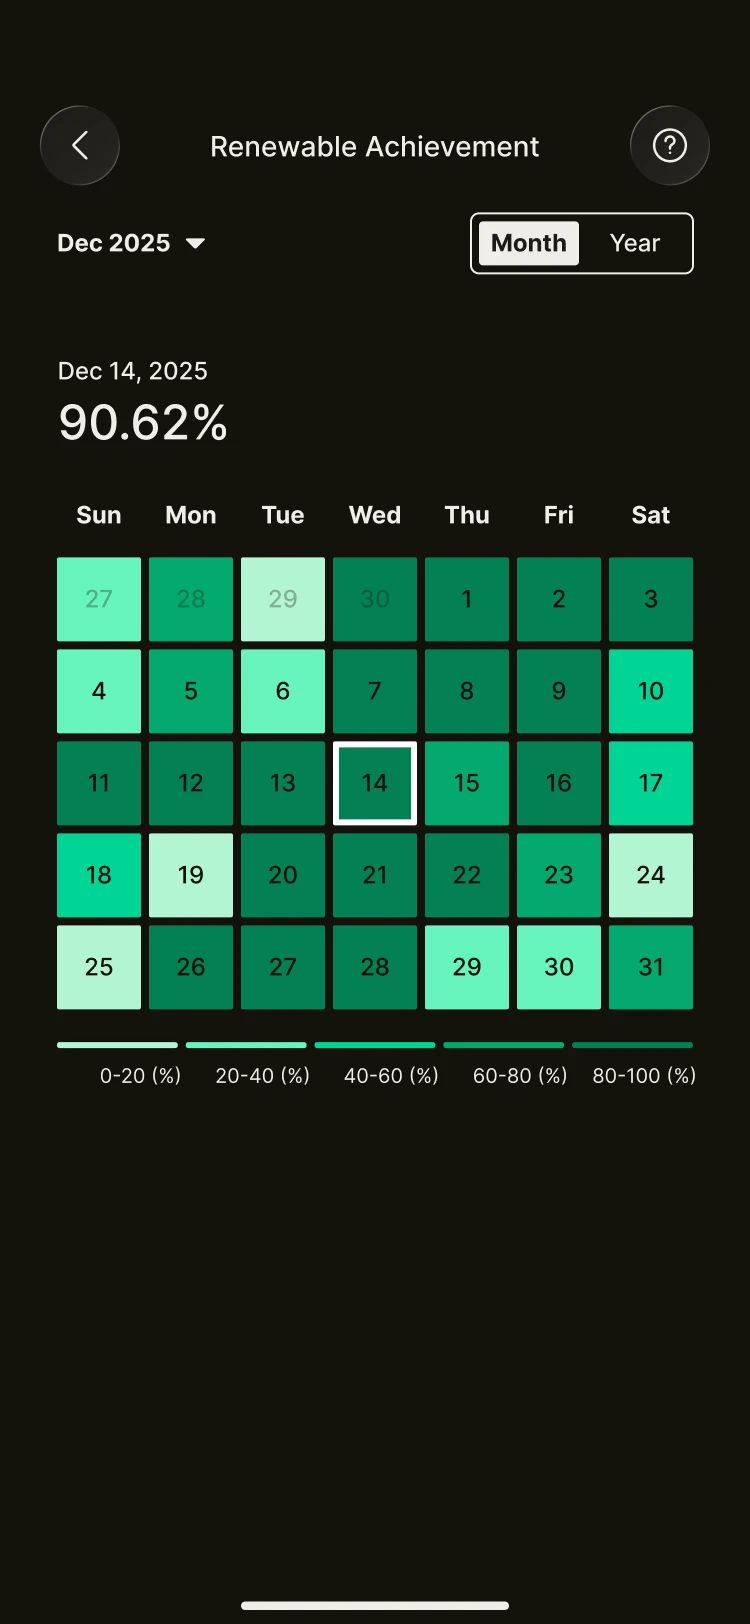
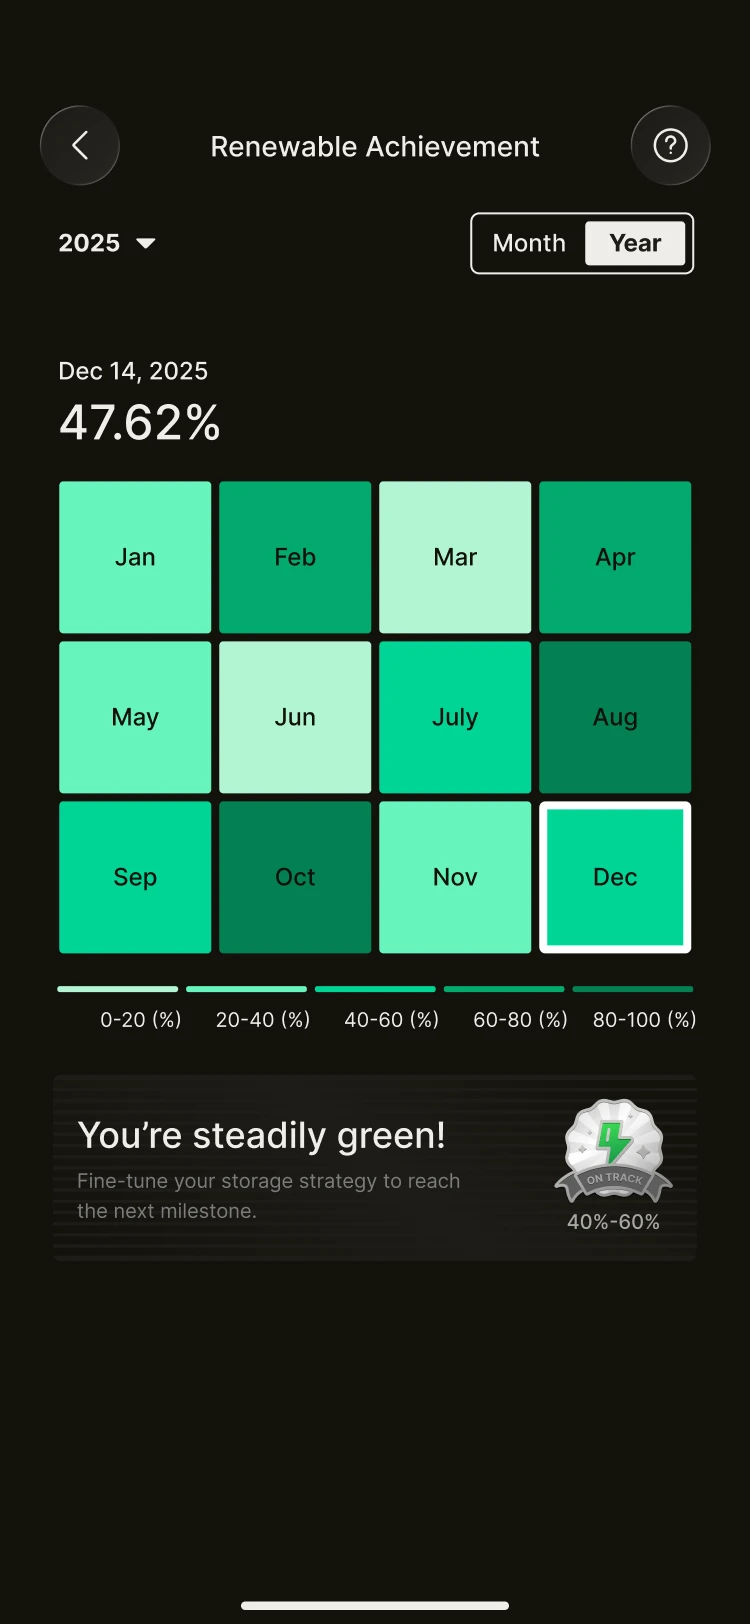
Renewable energy achievement
Renewable Energy Achievement shows how much of your home's energy use genuinely comes from solar and the battery. Based on your total household consumption over the selected time range, the system calculates the proportion supplied by renewable energy and presents it clearly. As this proportion rises, your home will:
- Rely less on the grid
- Lower your electricity costs
- Move closer to a sustainable lifestyle
INFO
Renewable energy achievement is affected by the season and the weather. In winter, when there is less sunshine, the figure is usually lower than in summer. If the figure remains low over a long period, it generally means solar supply is insufficient, and you may wish to consider increasing your PV capacity or optimising your system configuration.