Energy Data
Round-the-clock energy dynamics
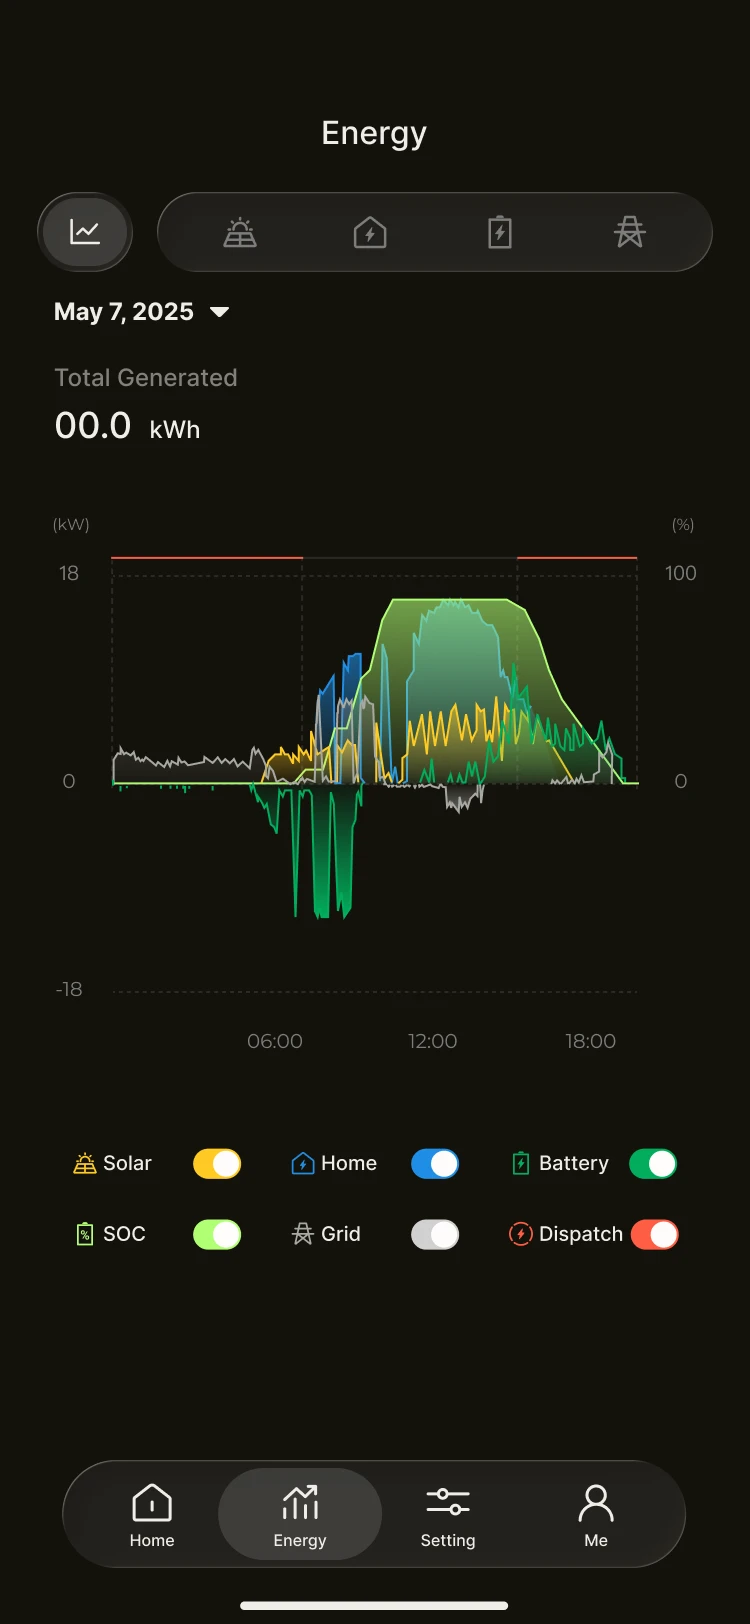
The energy charts bring together the operating traces of PV, storage, load and grid, allowing key parameters such as SoC, load power and feed-in status to be compared on a single screen.
With a high-frequency sampling accuracy of 5 minutes, the system reconstructs your home's energy flow trends in real time and in full, helping you pinpoint consumption peaks and optimise both storage returns and electrical safety.
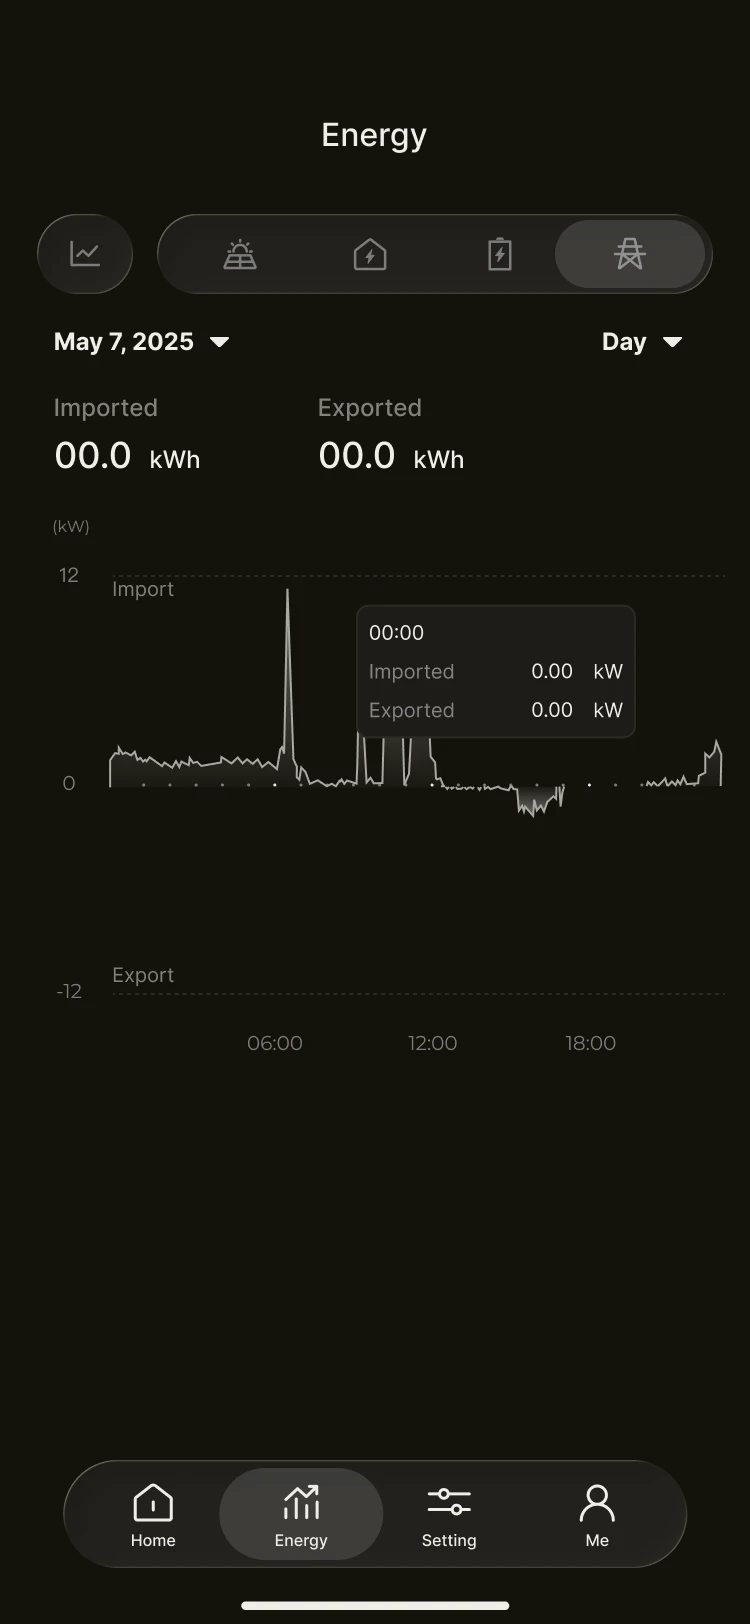
Historical data visualisation
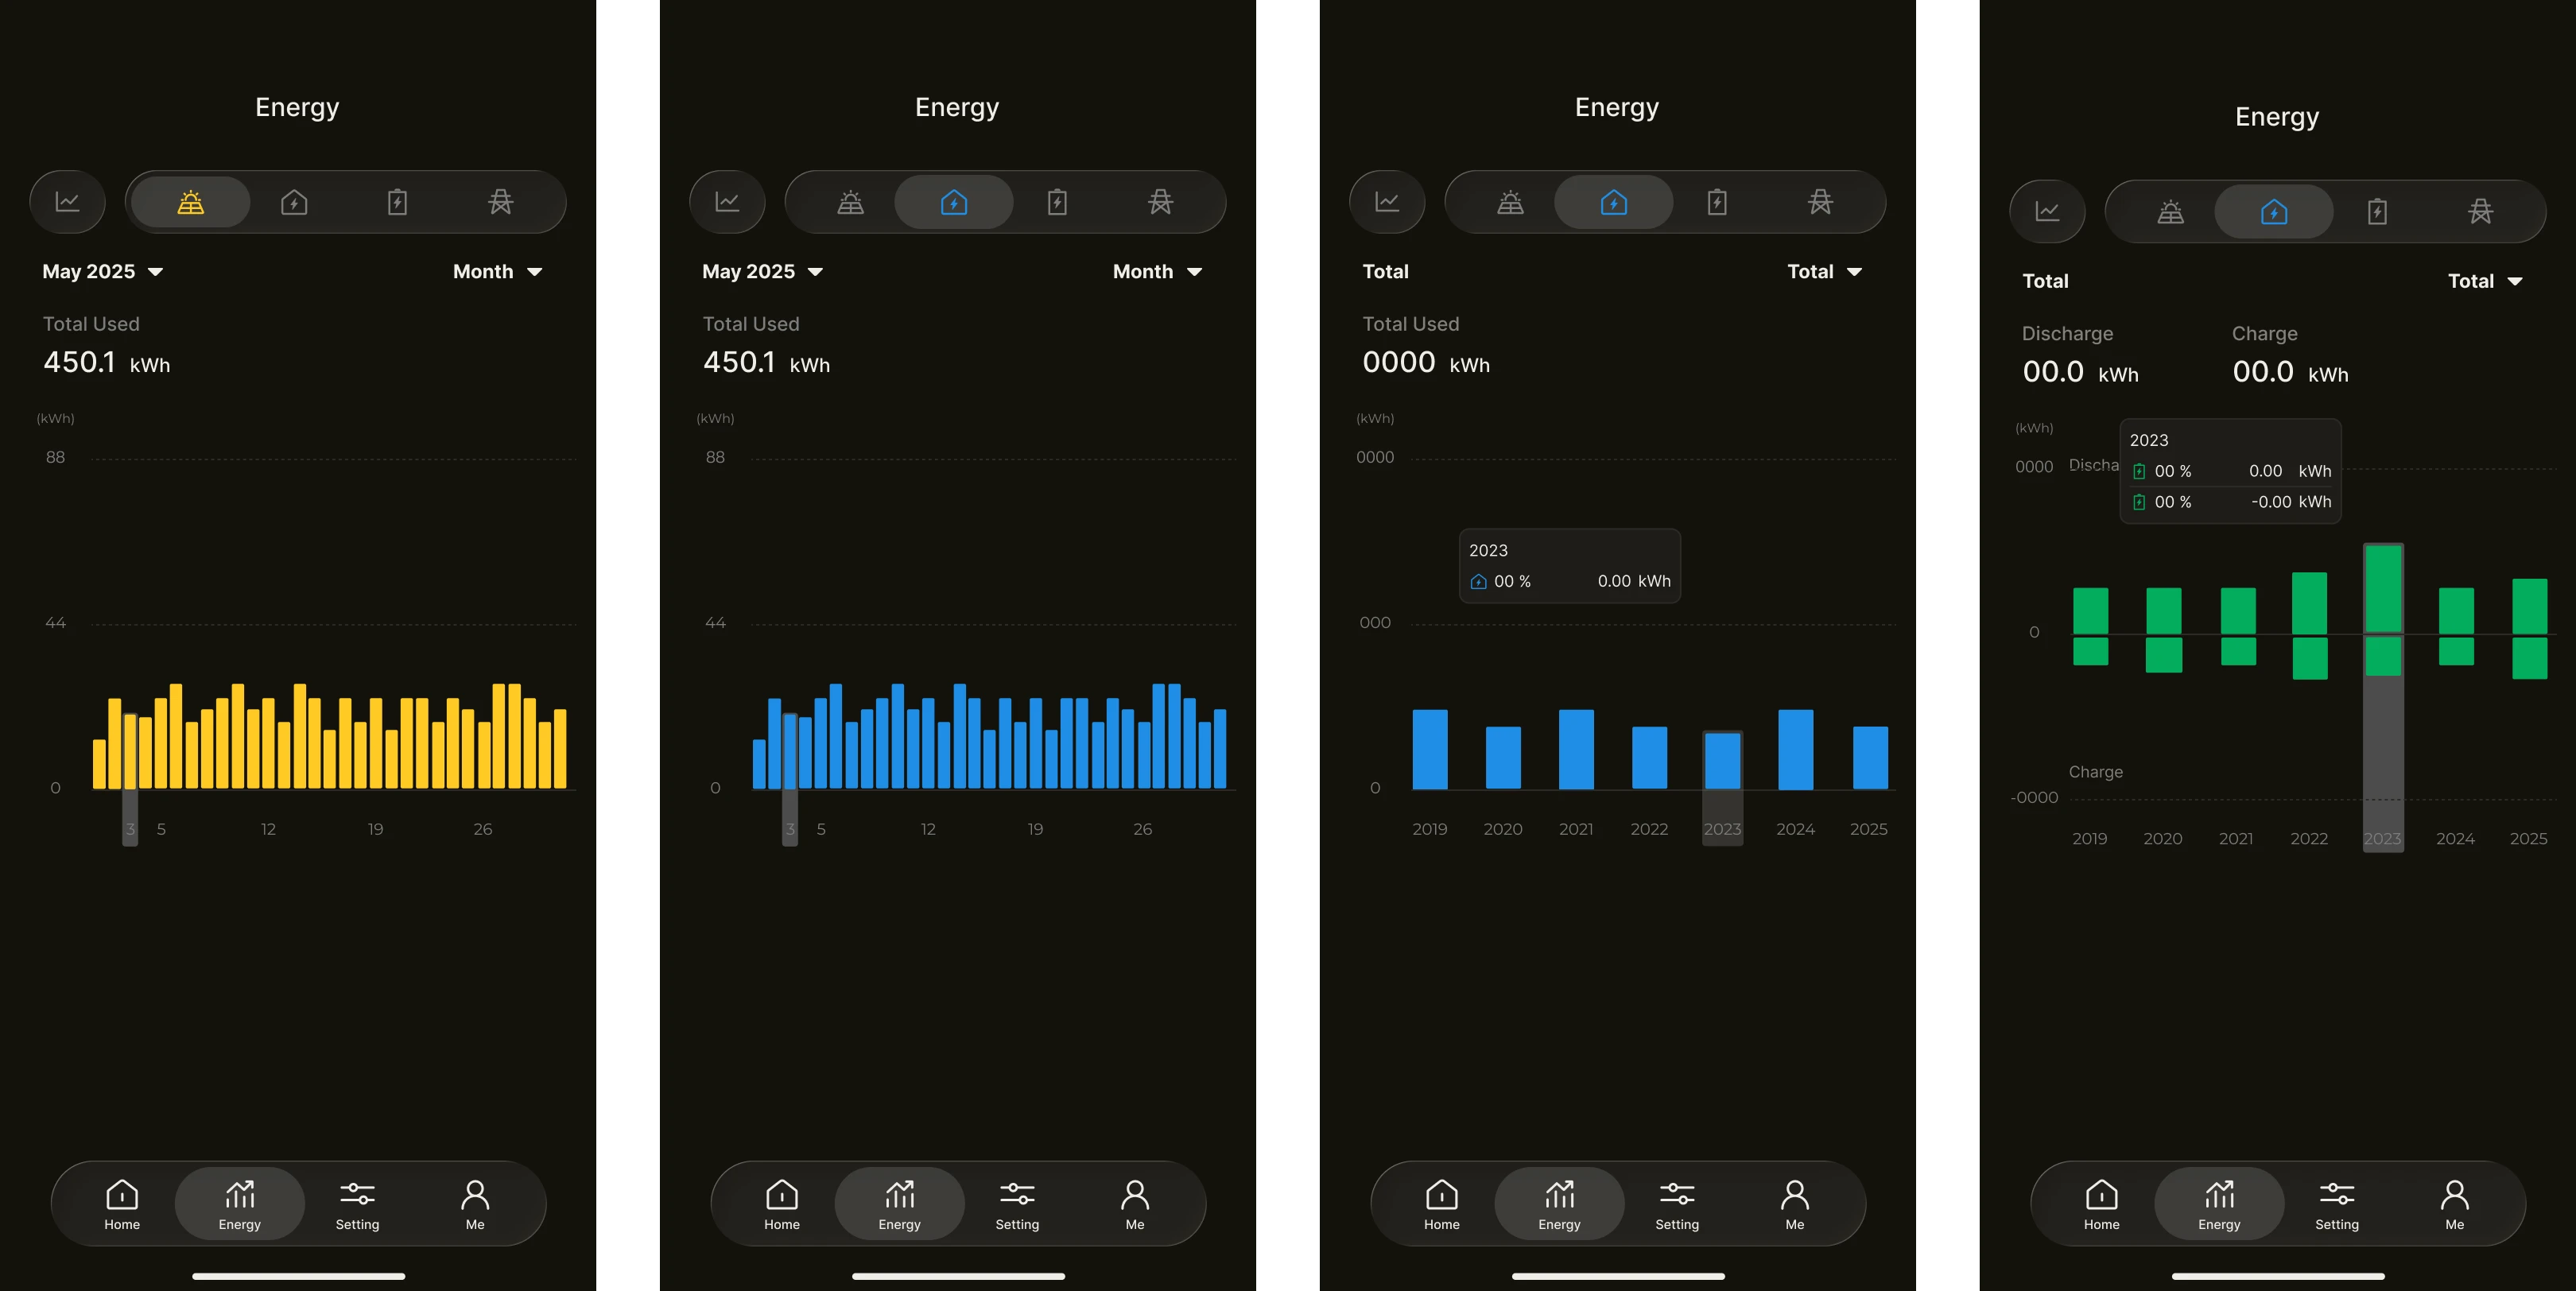
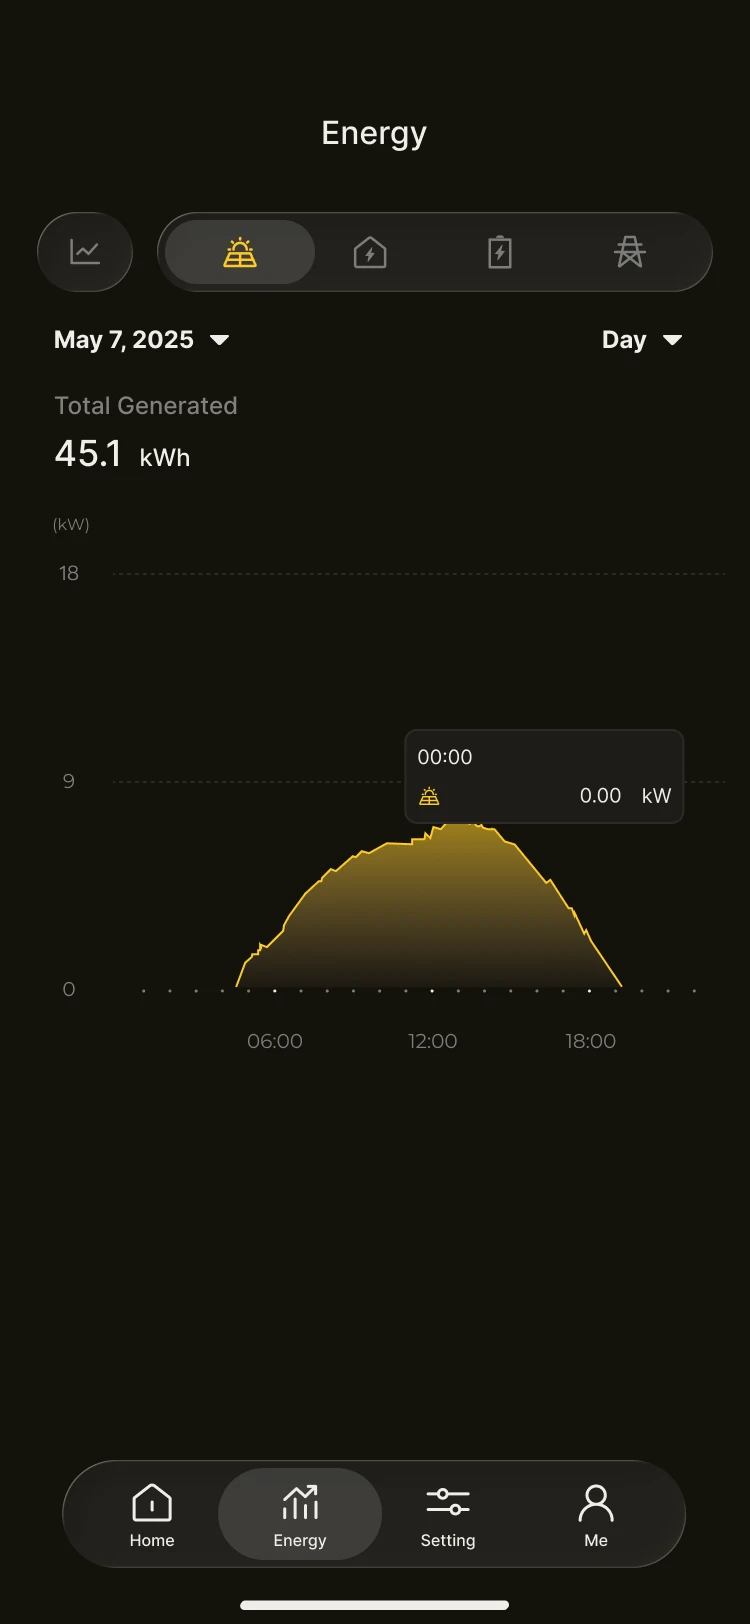
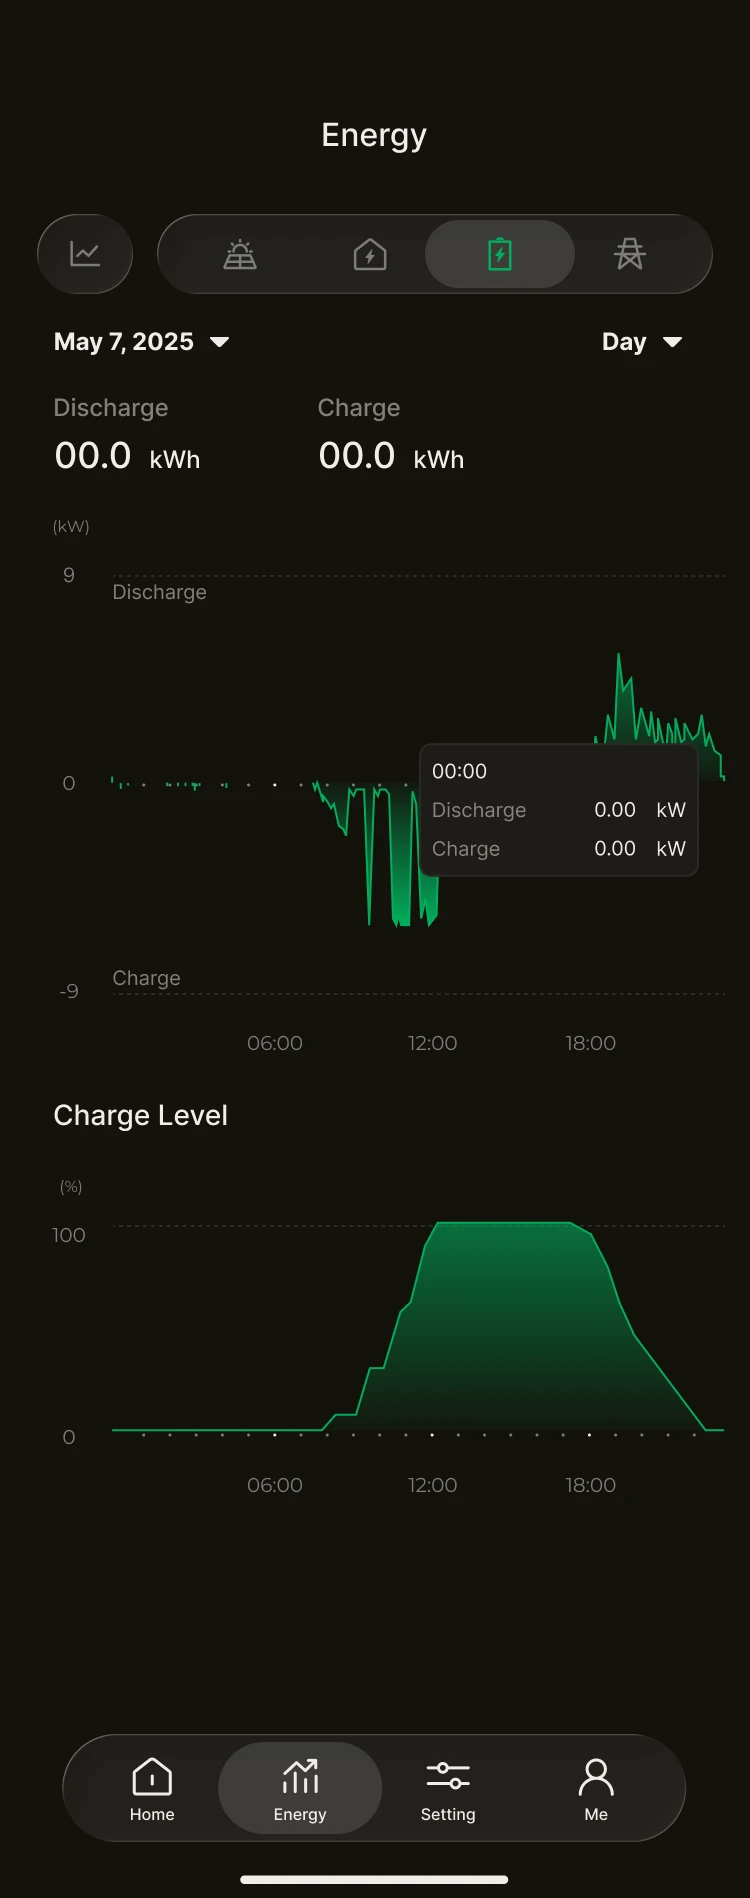
The data never lies, and your returns are there to see. In the Energy Data module you can view energy reports by day, month, year or lifetime.
- Generation statistics: how much clean energy your PV has contributed.
- Load statistics: how much energy the plant has consumed.
- Battery statistics: the energy charged to or discharged from the battery.
- Grid statistics: the energy the plant has bought from or sold to the grid.