Site and System Overview
Once the equipment has been installed and commissioned, you can use the site / system overview for day-to-day monitoring. Log in and select your Workspace to access it.
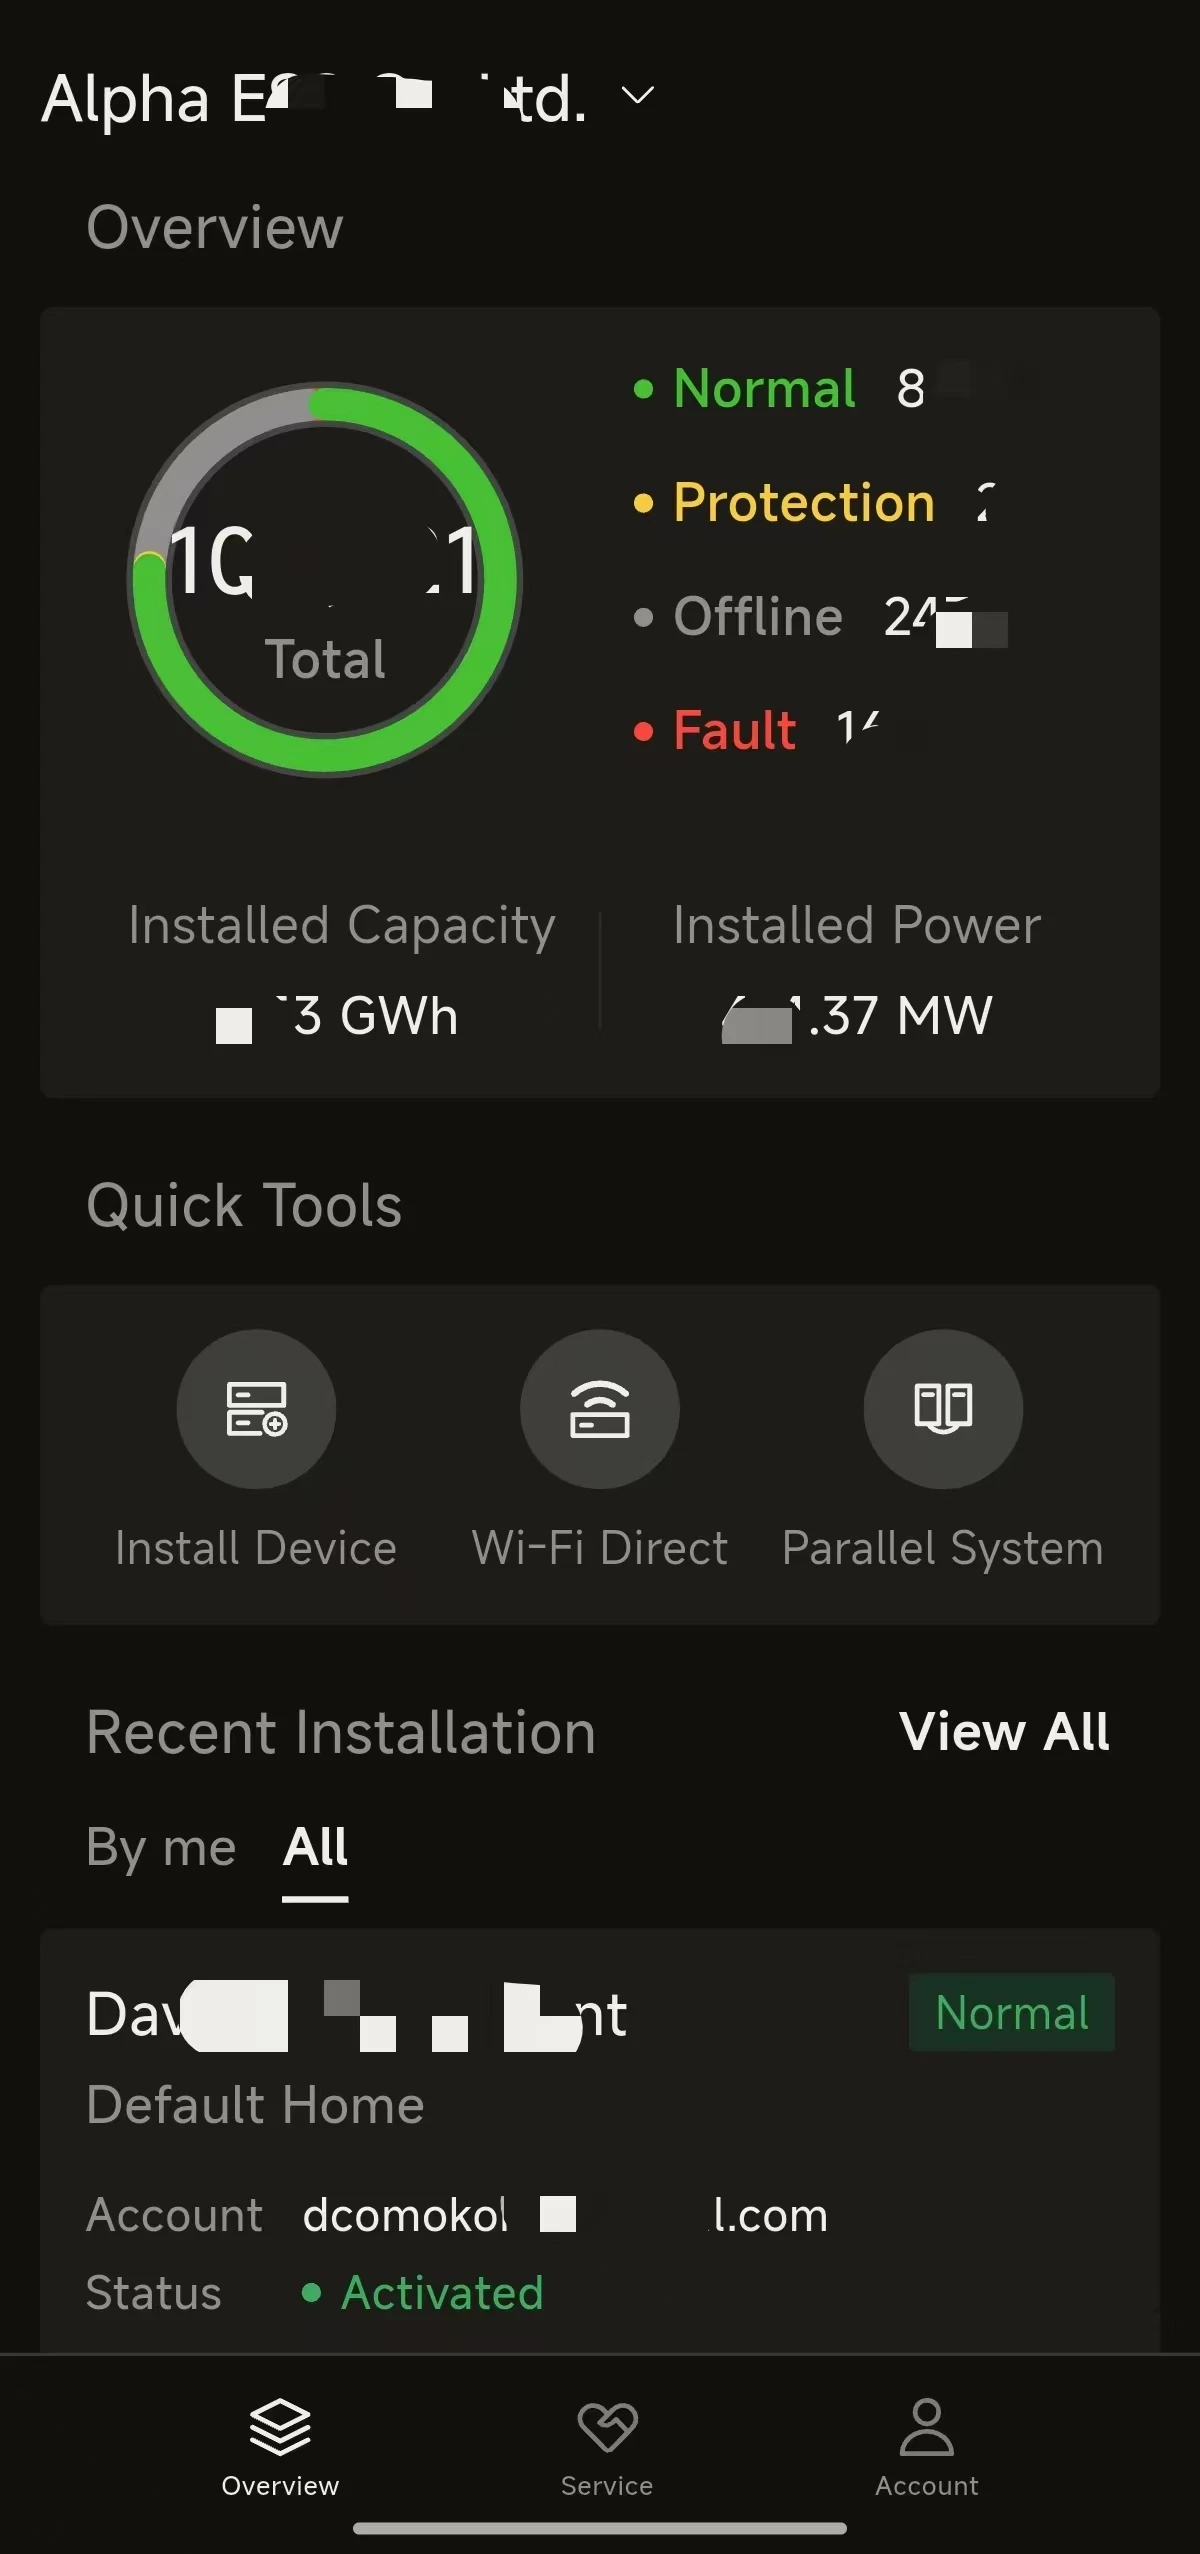
(1) Site / System List
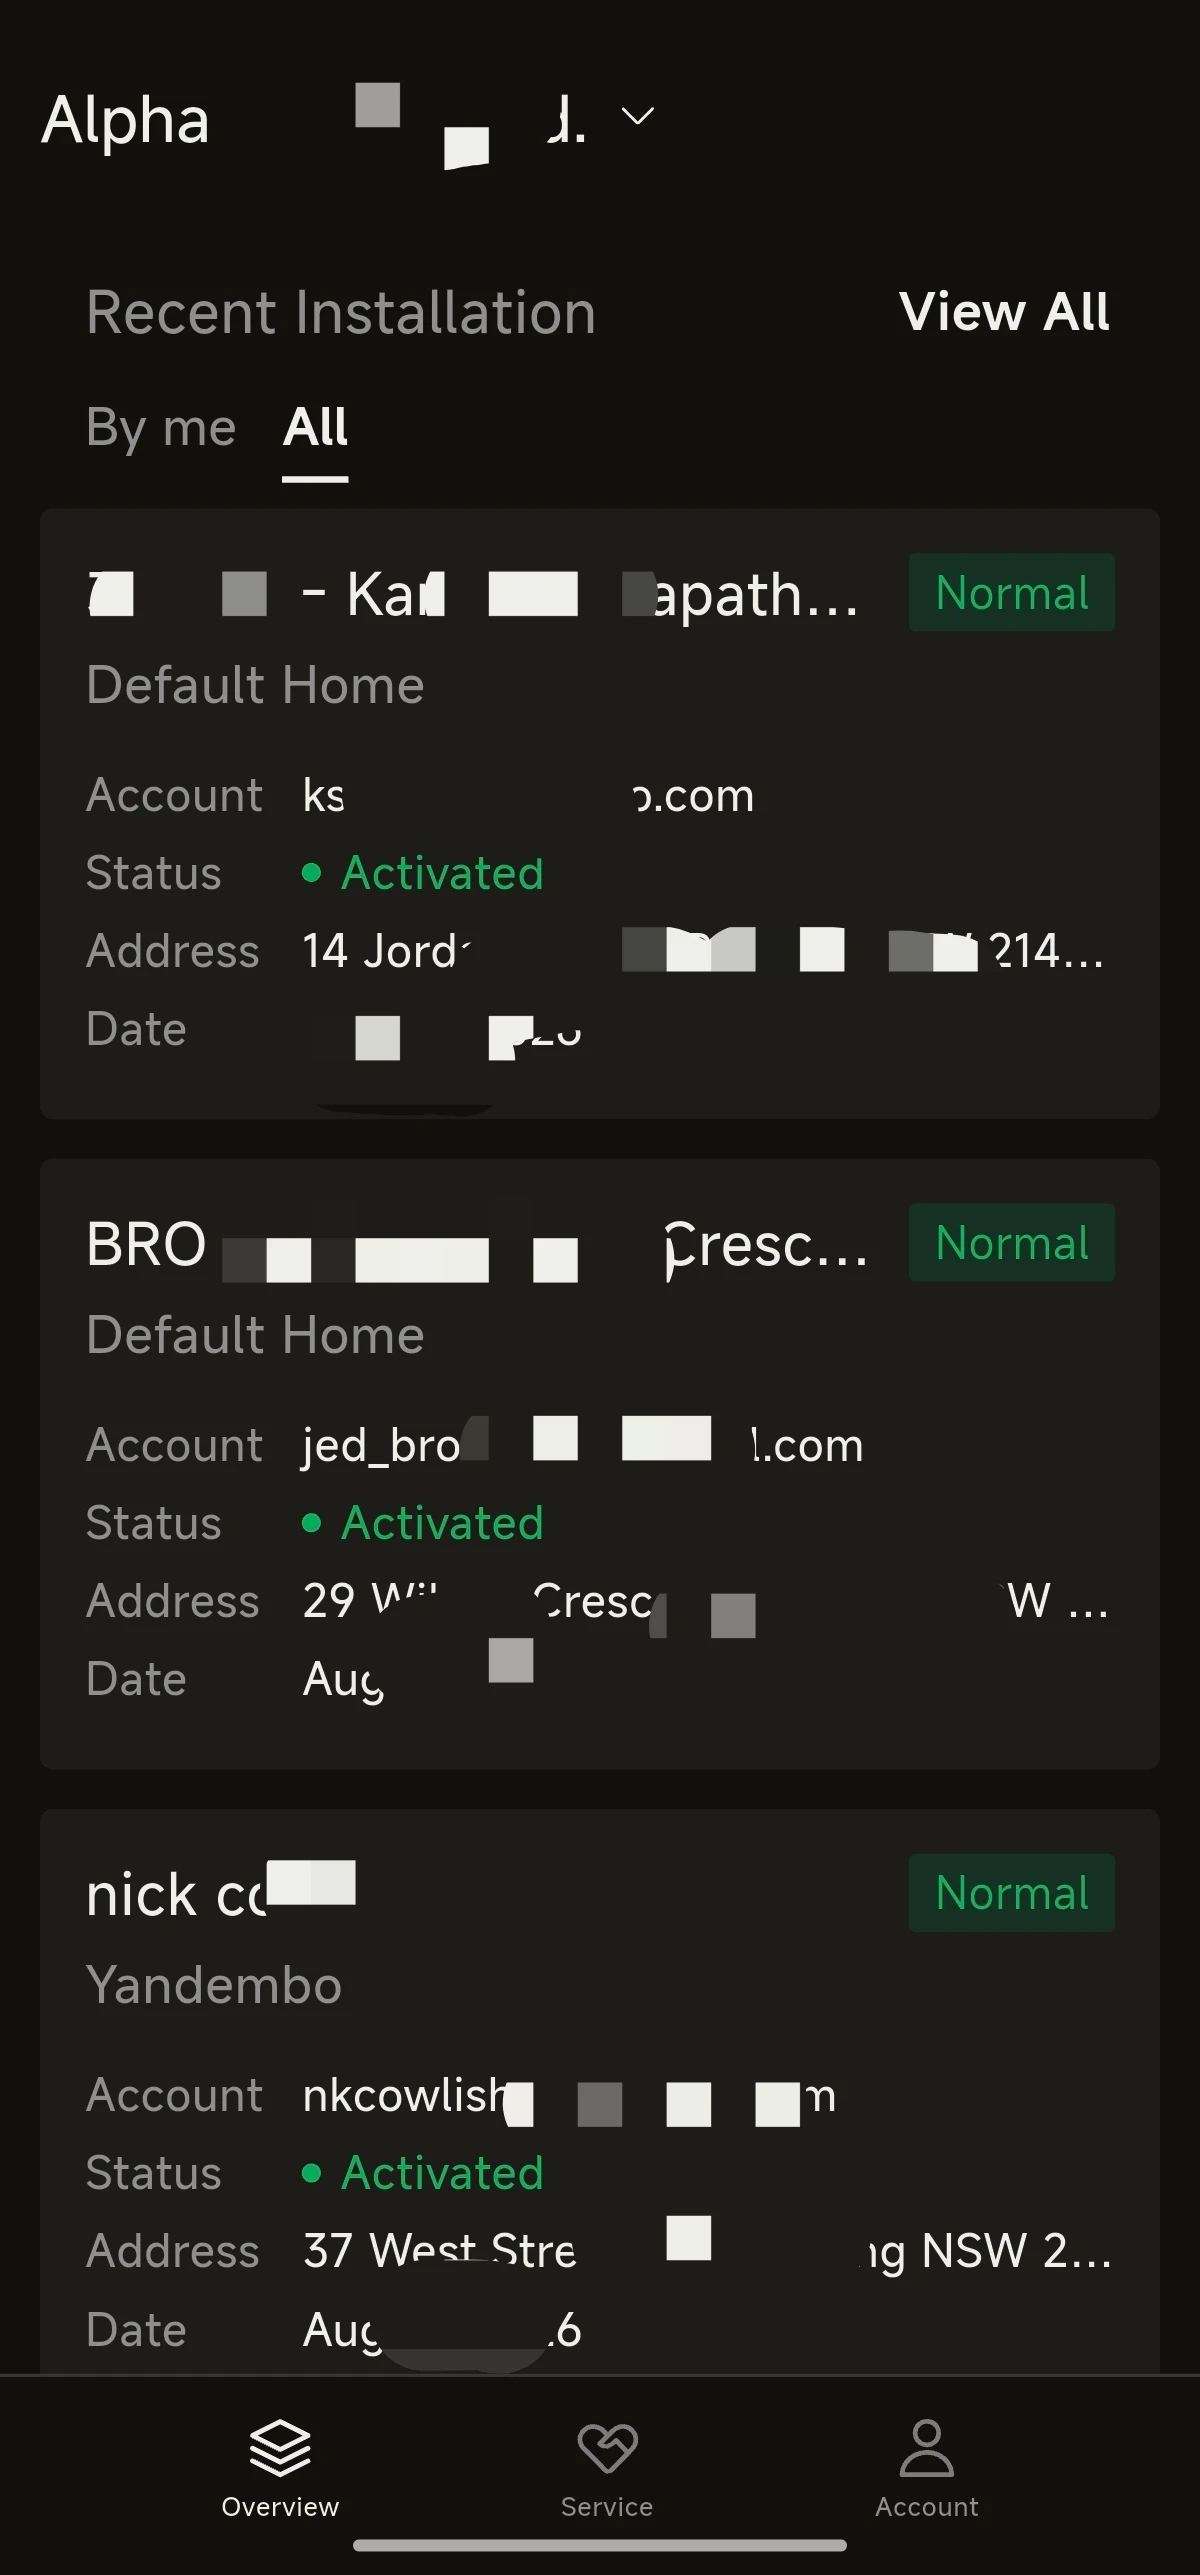
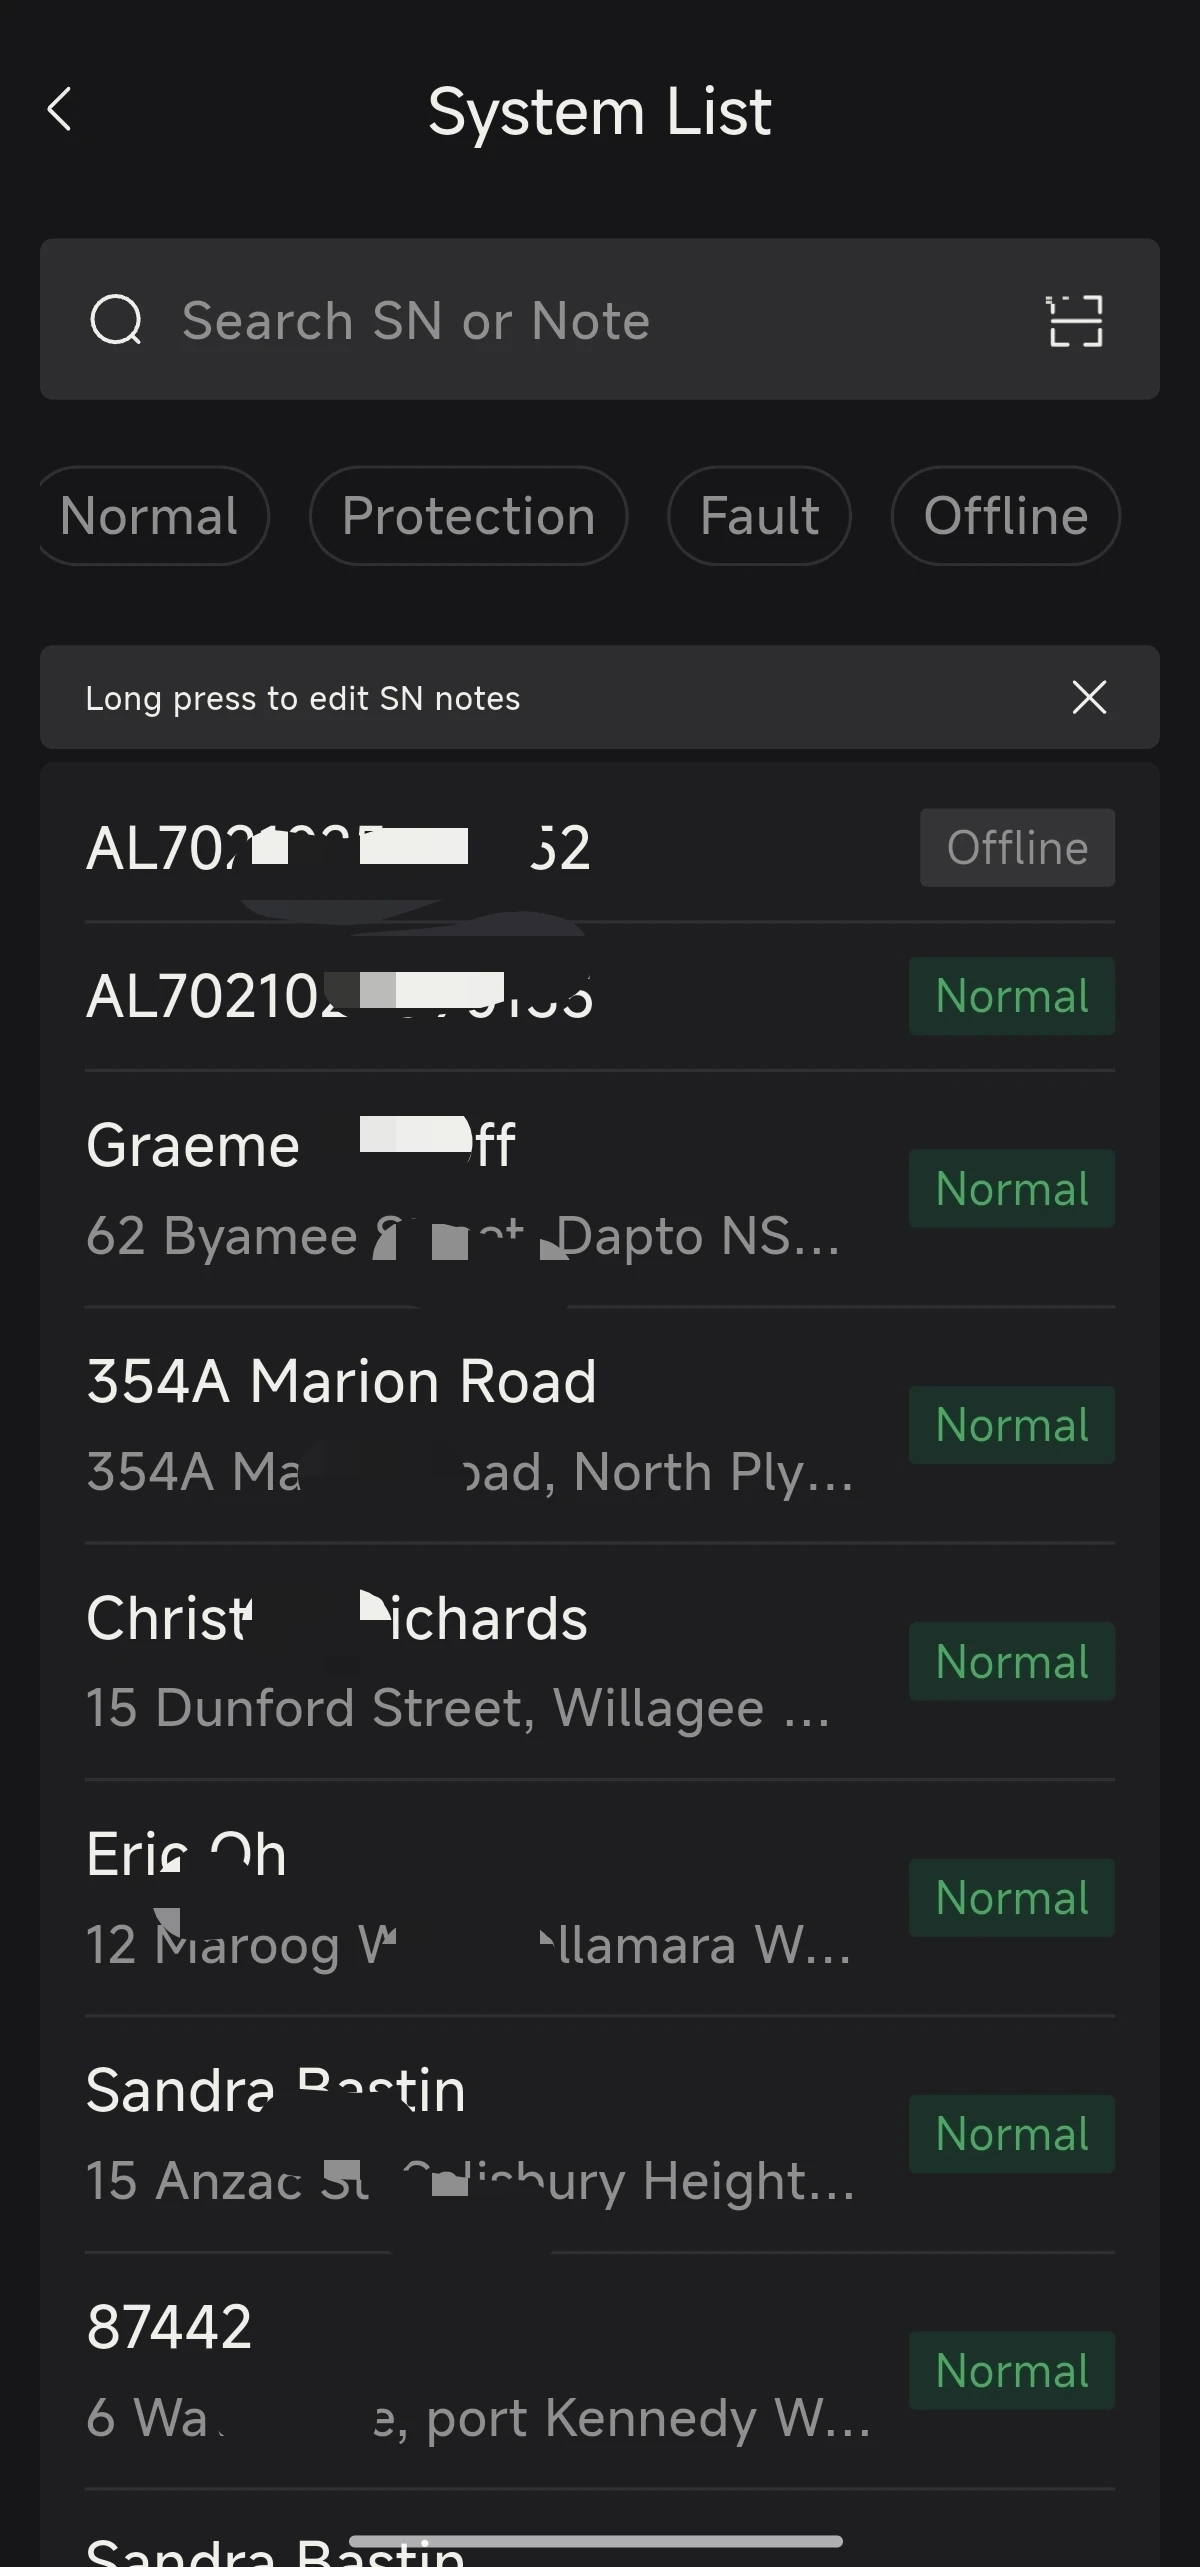
- Go to the Site / System List, where you can search by site name / SN.
- Tap the target site to open its overview.
(2) Overview – Energy Flow
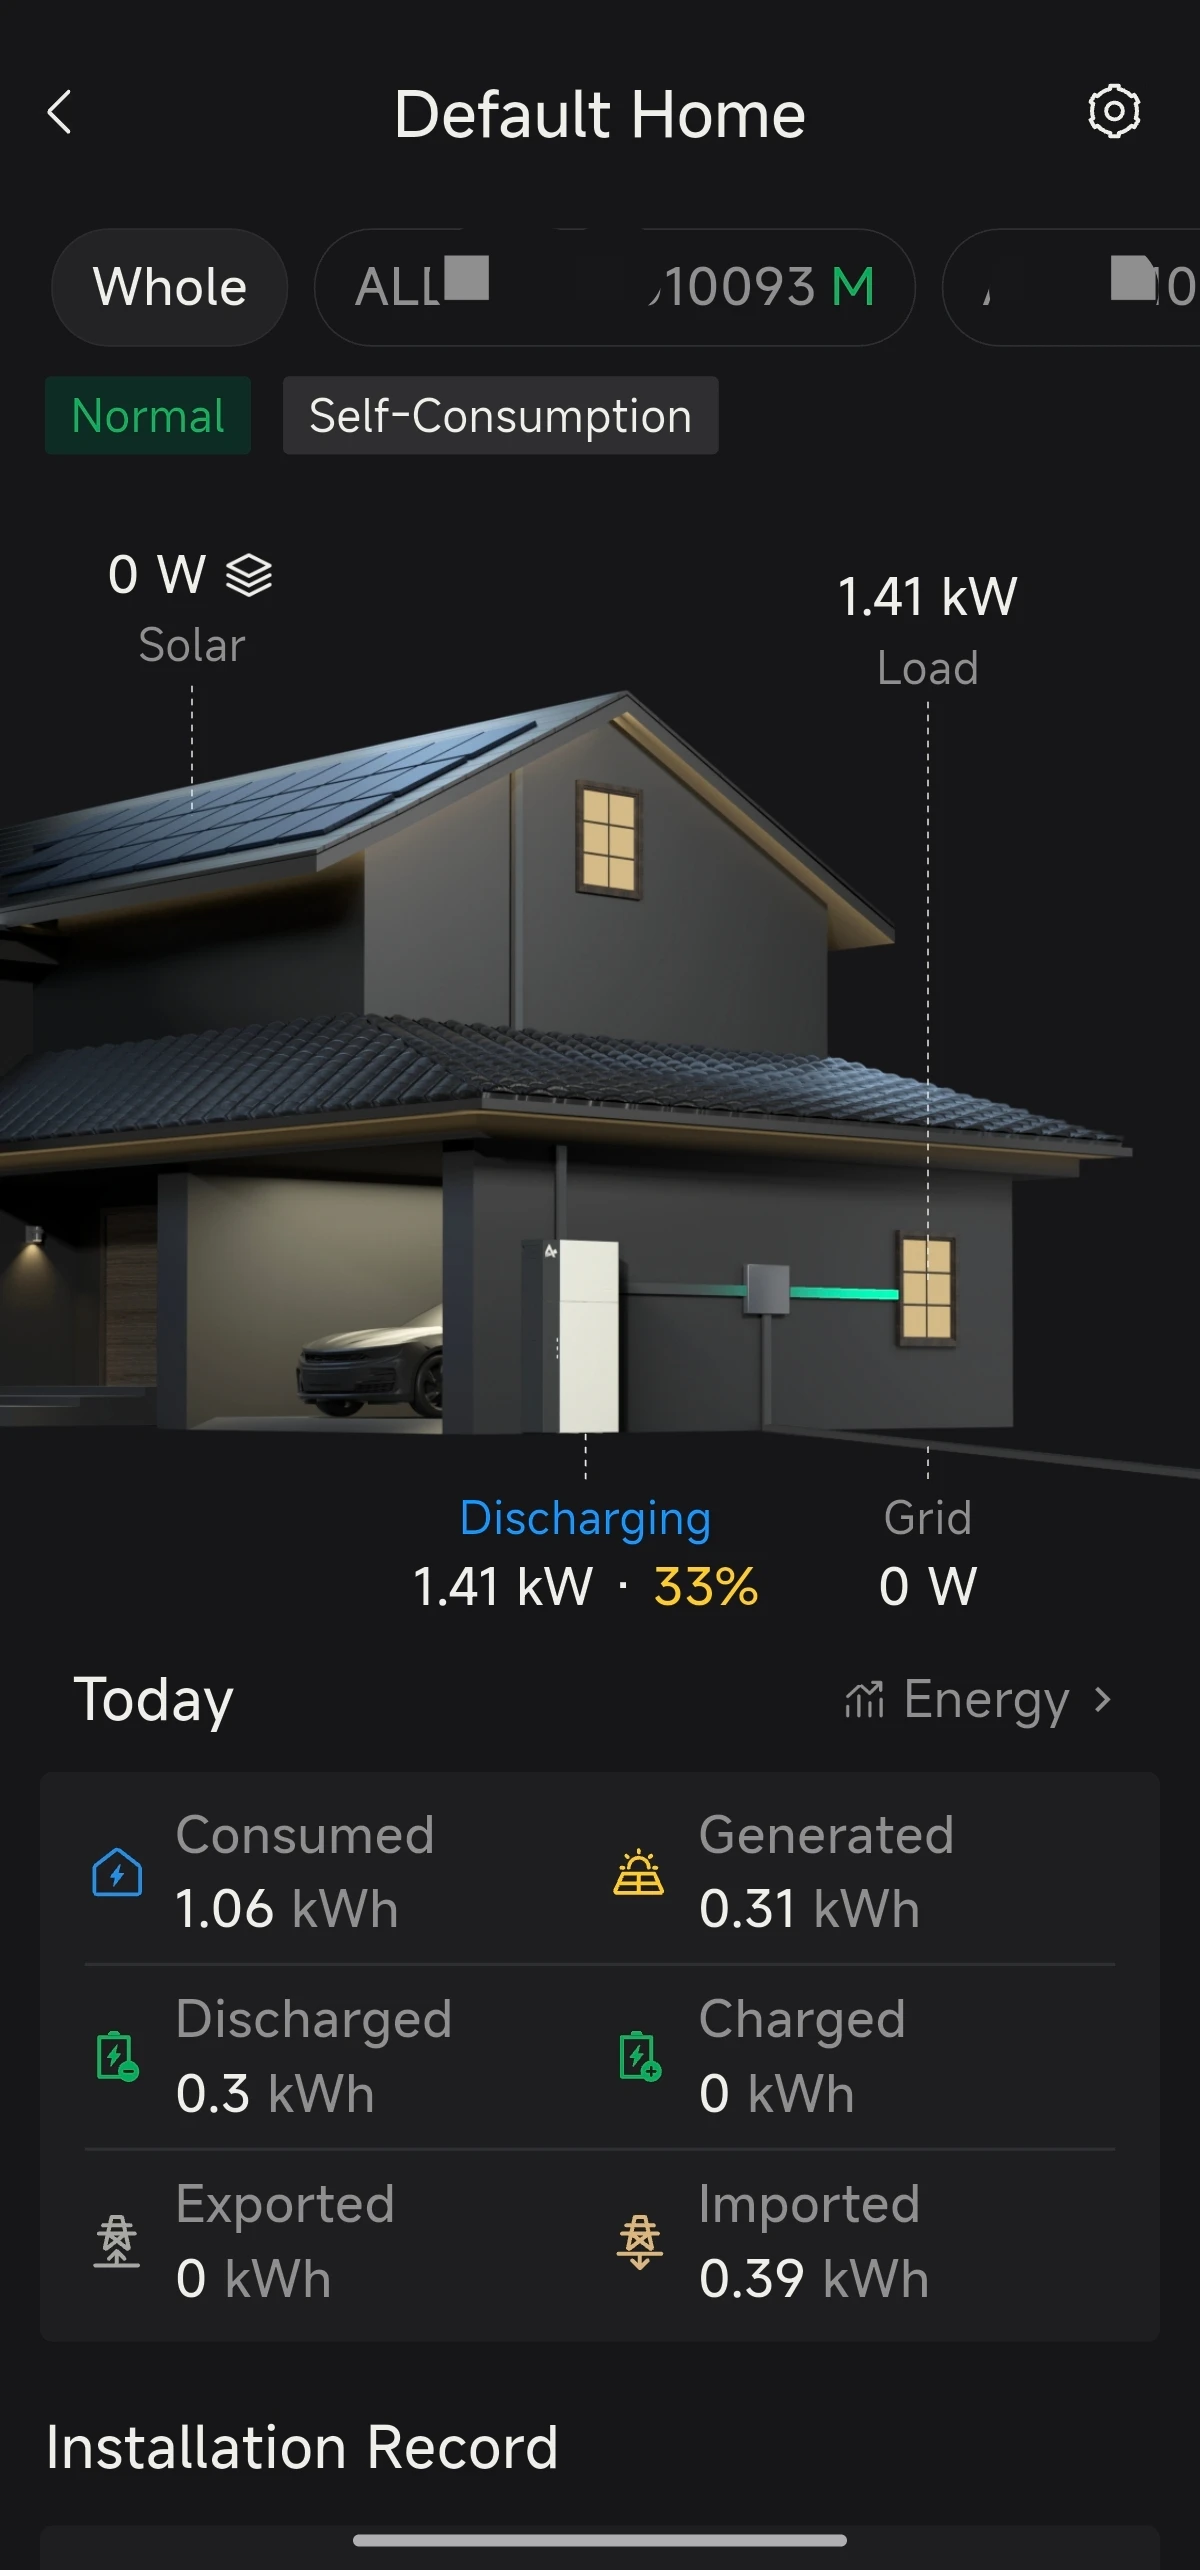
- Status indicator at the top: Normal (all online) / Offline (all offline) / Partially Online (some devices offline) / Fault (a fault is present). When devices are offline, you can tap through to the "Offline Devices" list.
- Energy flow visualisation in the middle: shows the real-time power flow direction and current power values between PV, grid, load, battery (and the EV charger, etc.).
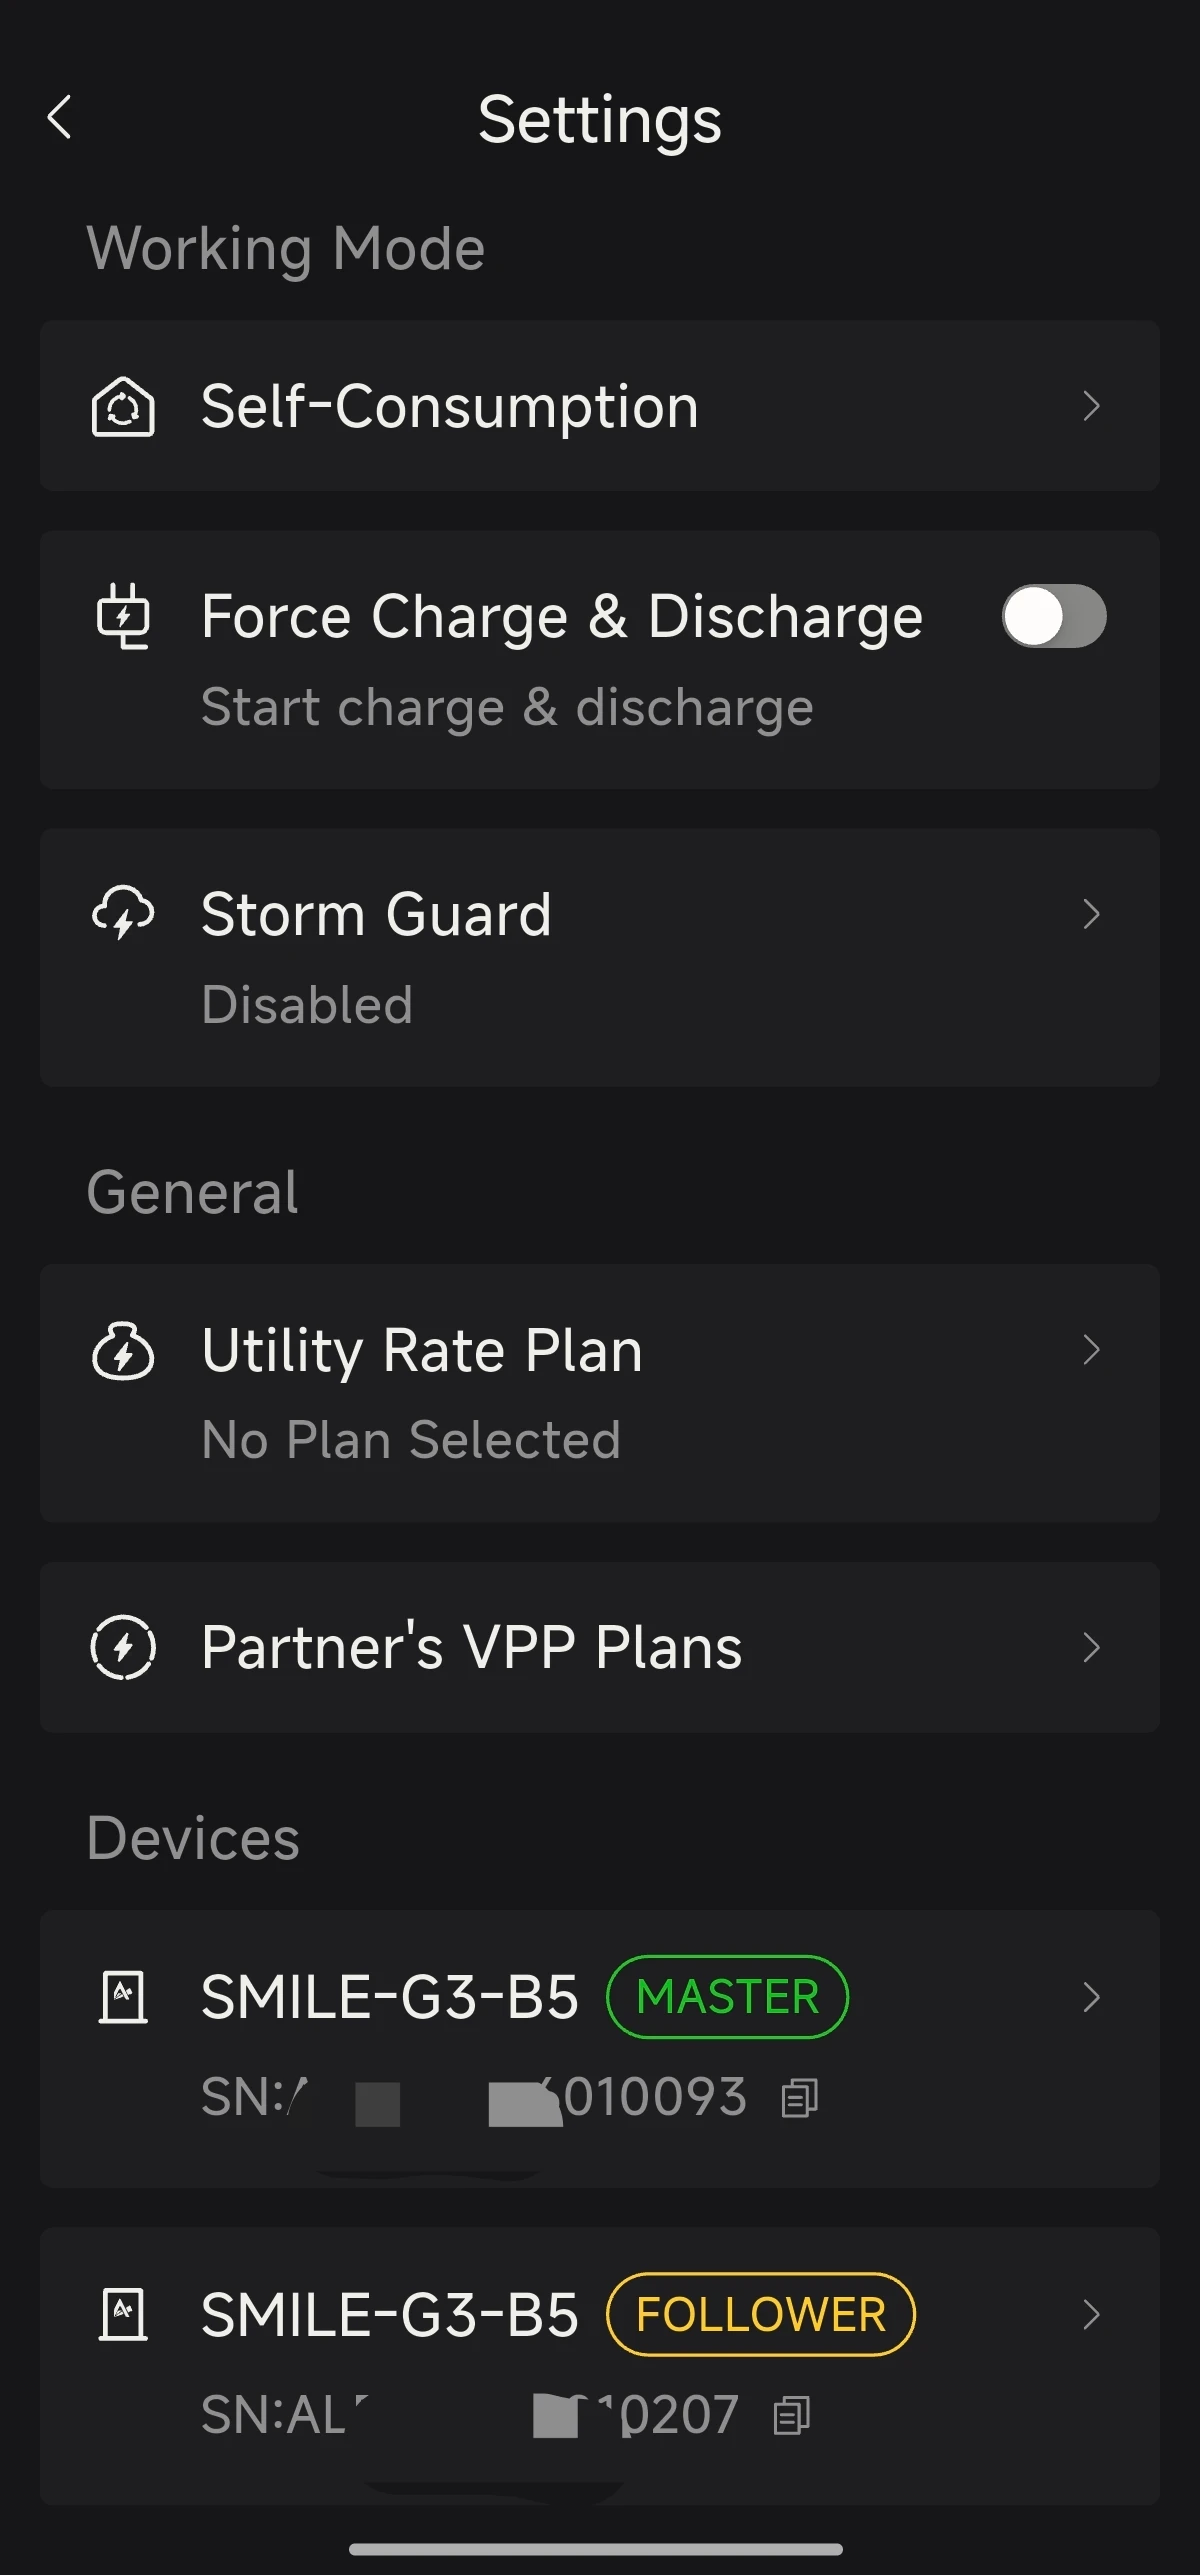
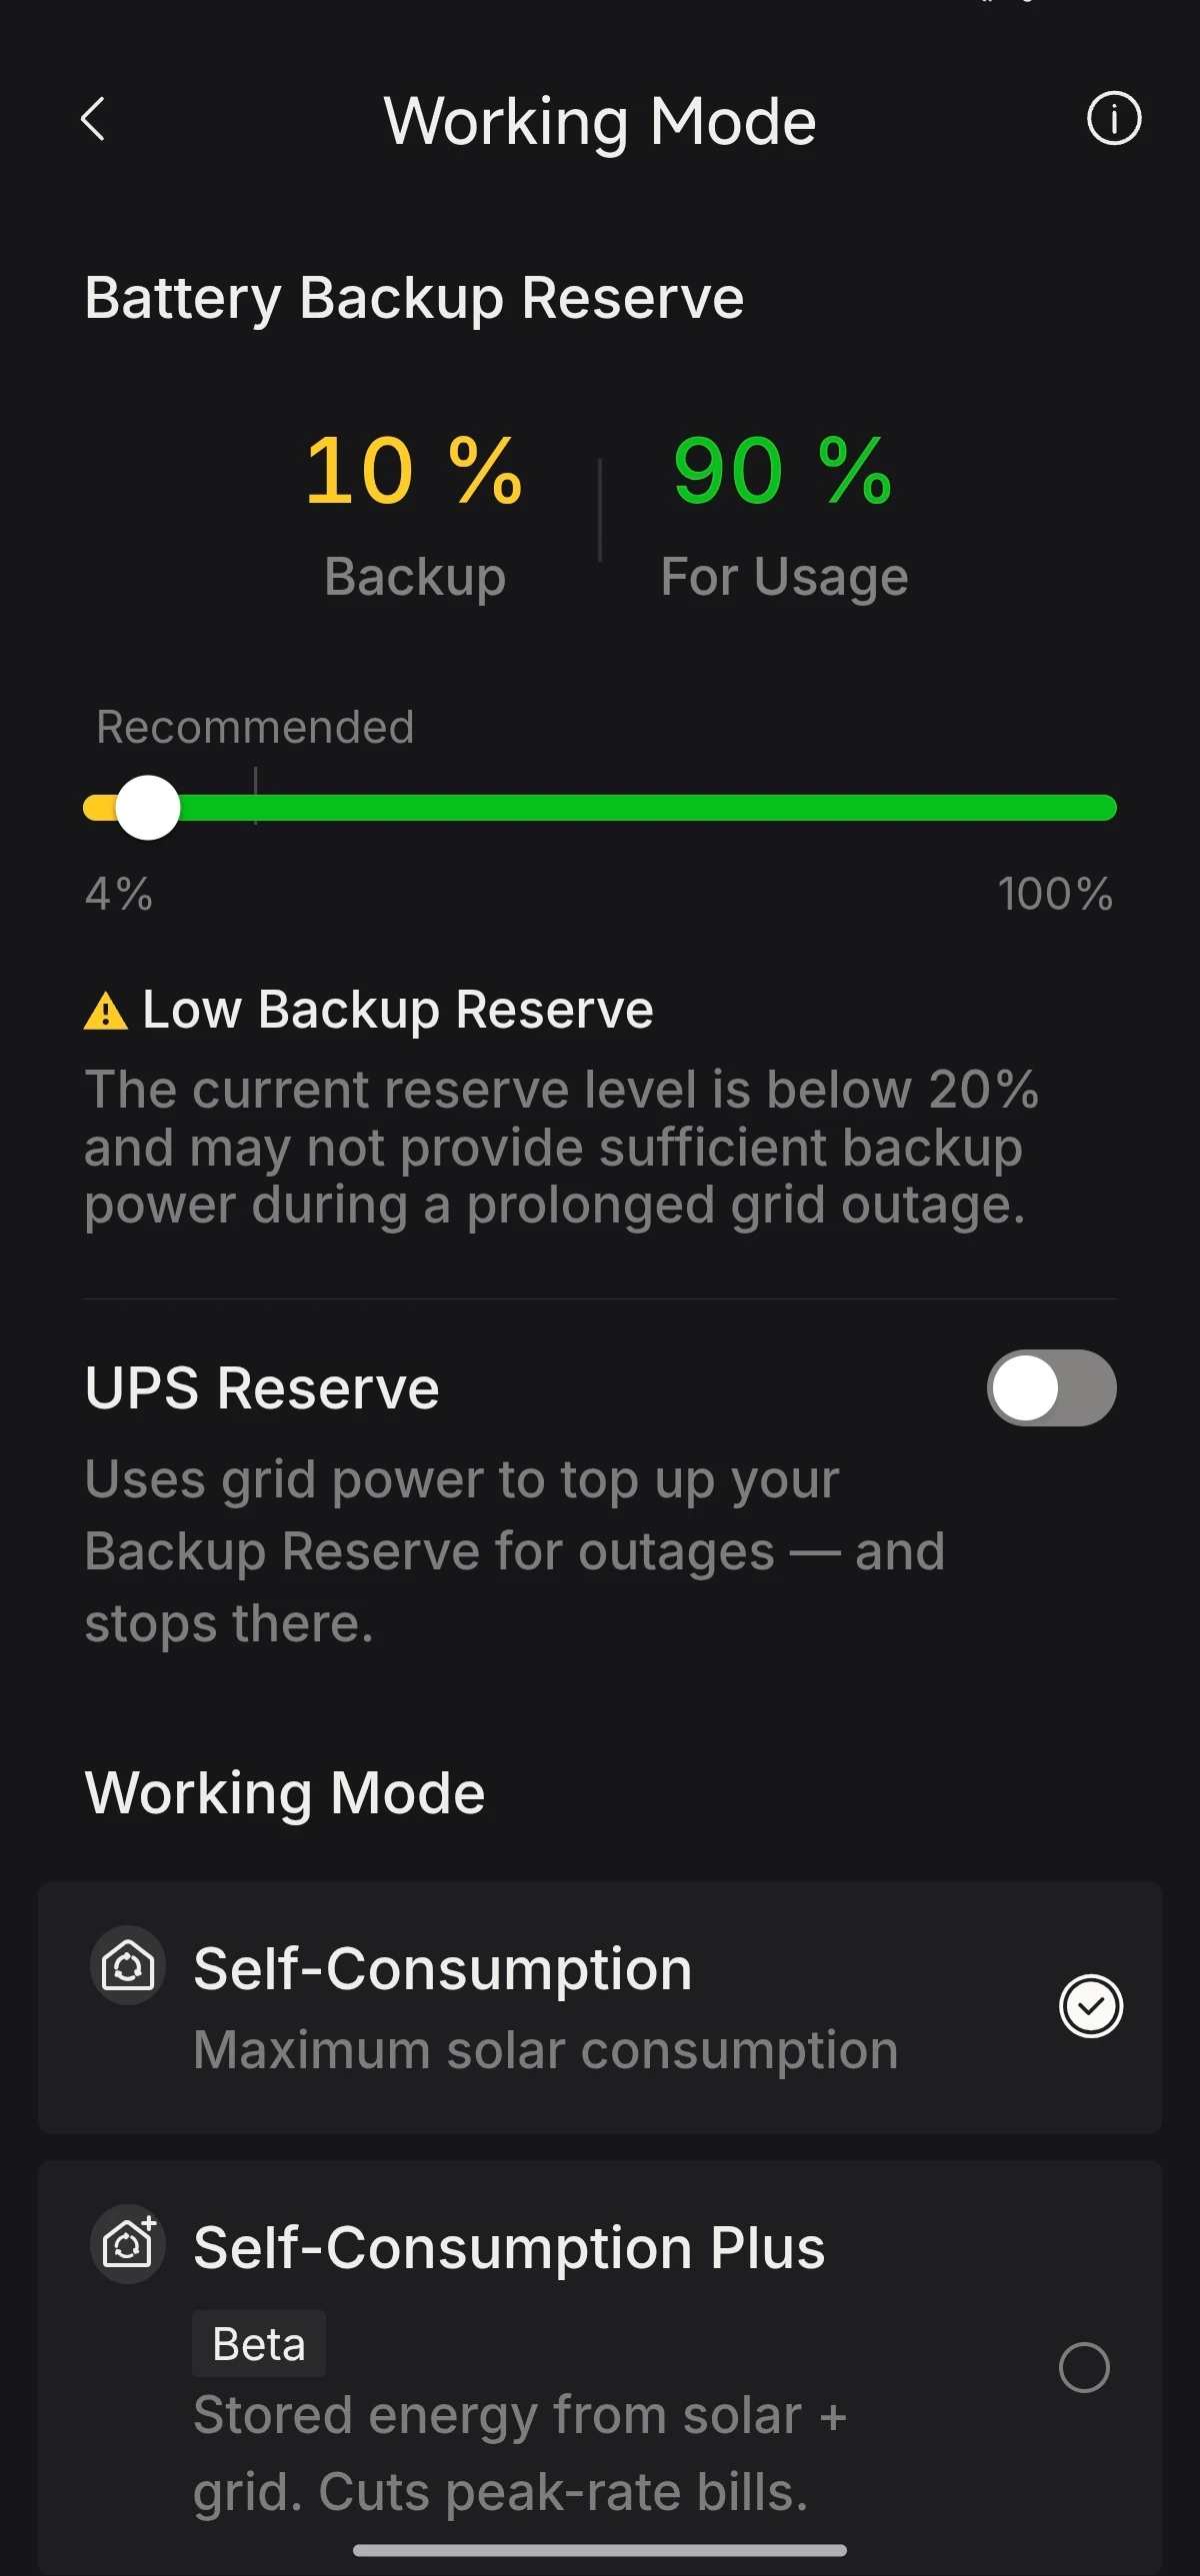
- Tap the top right corner to view and configure the site's work mode, tariff information, VPP dispatch and individual devices.
(3) Energy Charts and Data
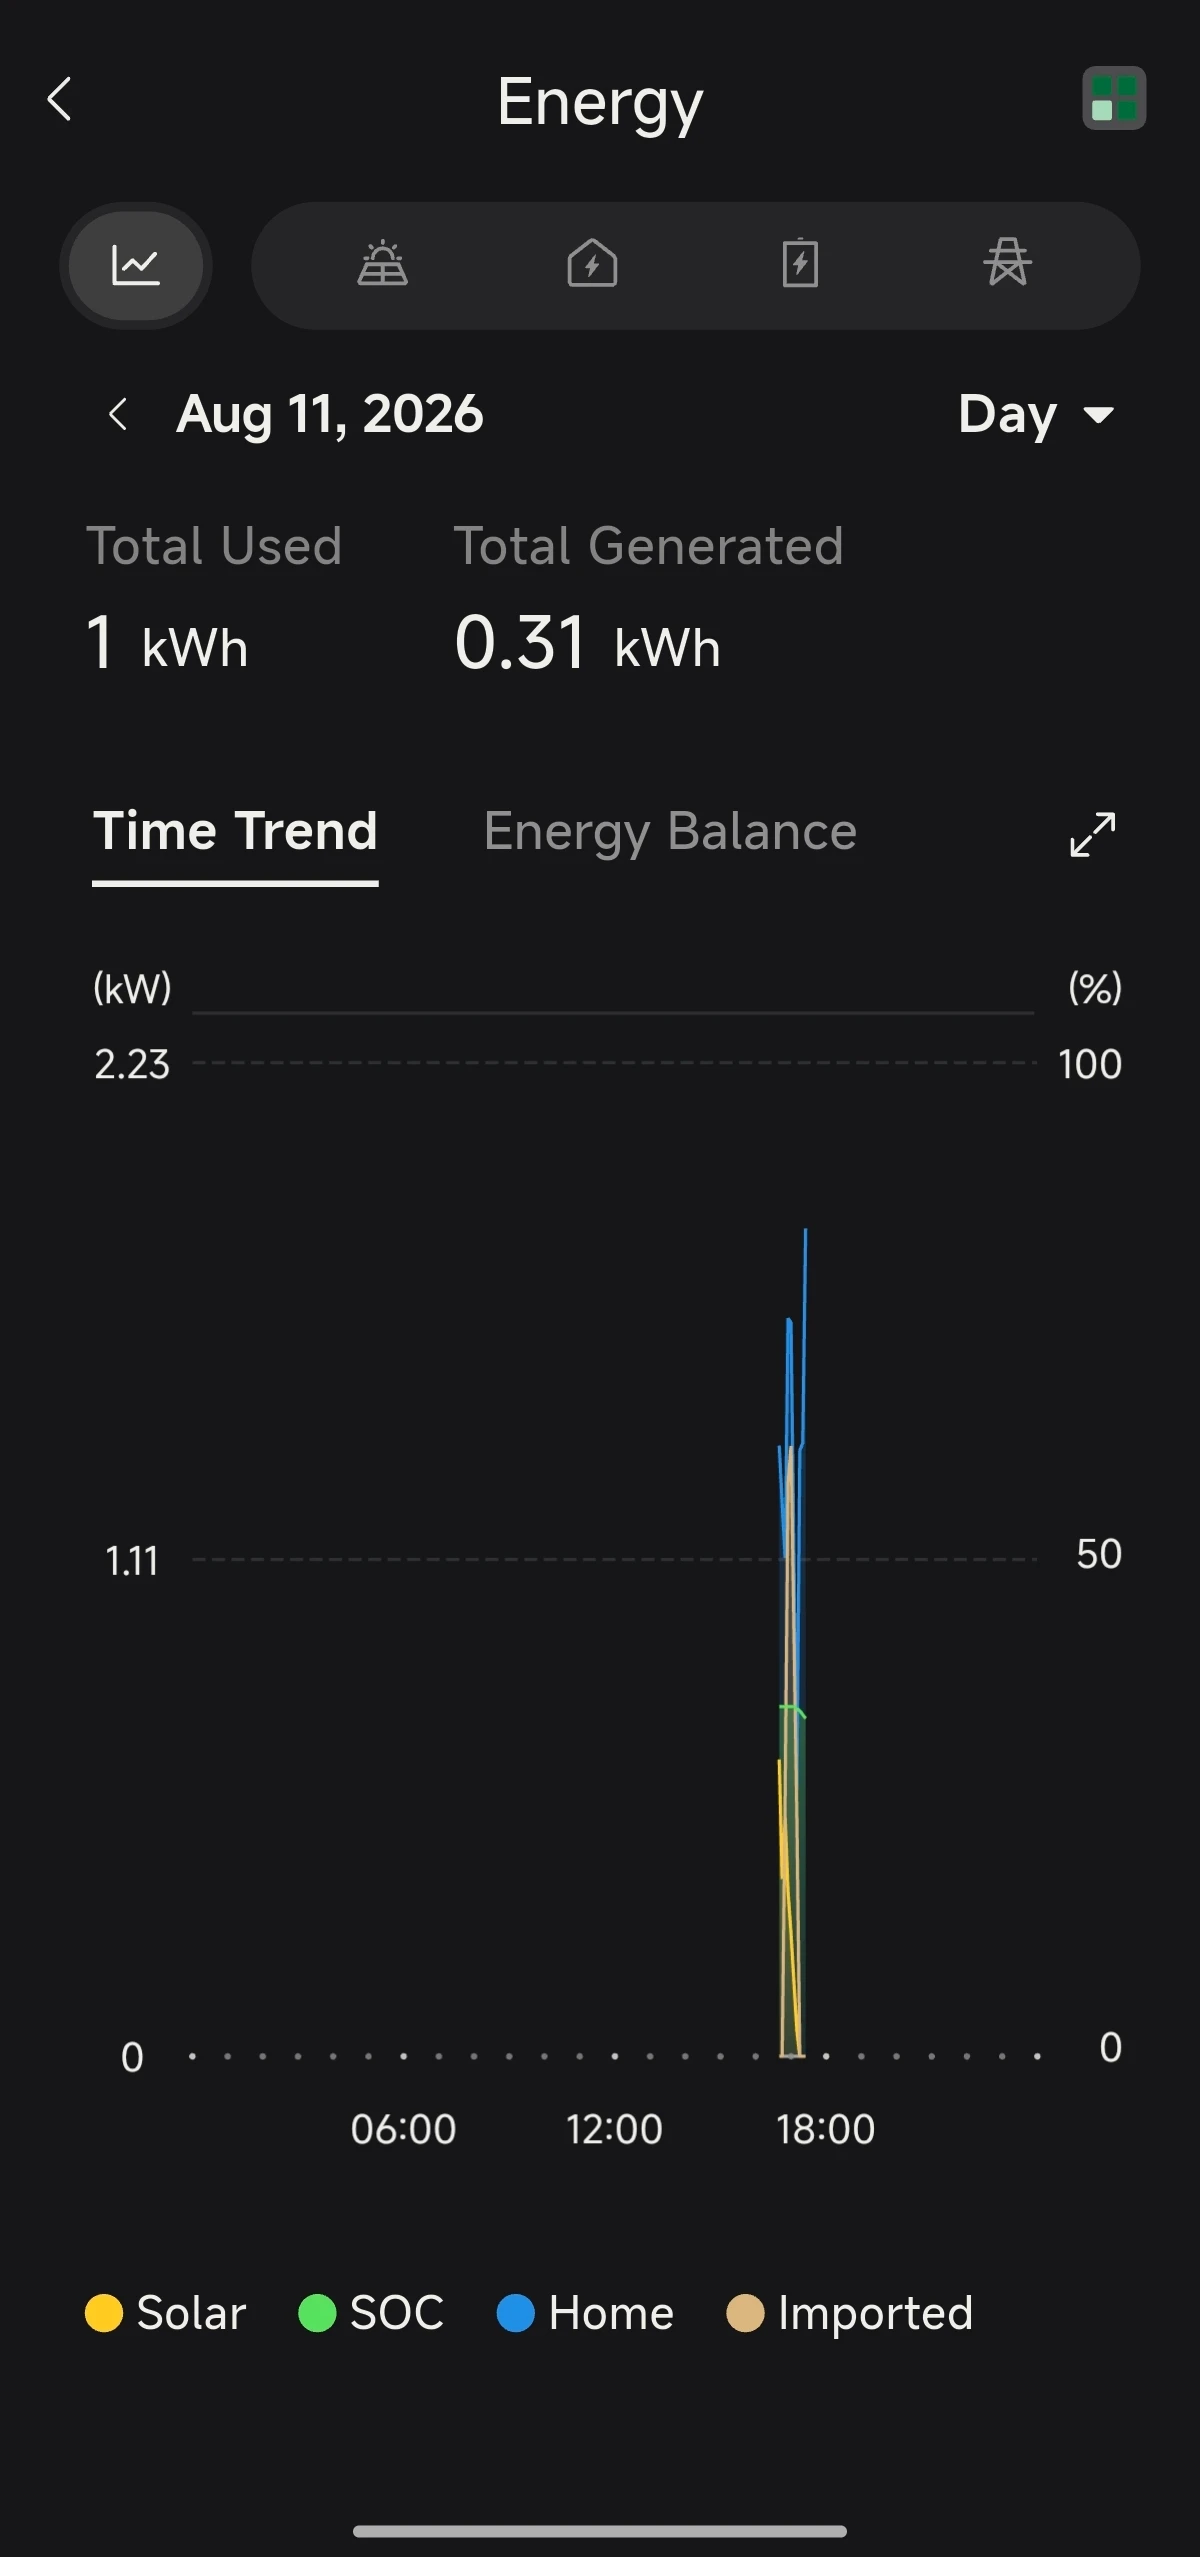
- Switch between the day / month / year views to see consumption trends and the balance between generation and consumption.
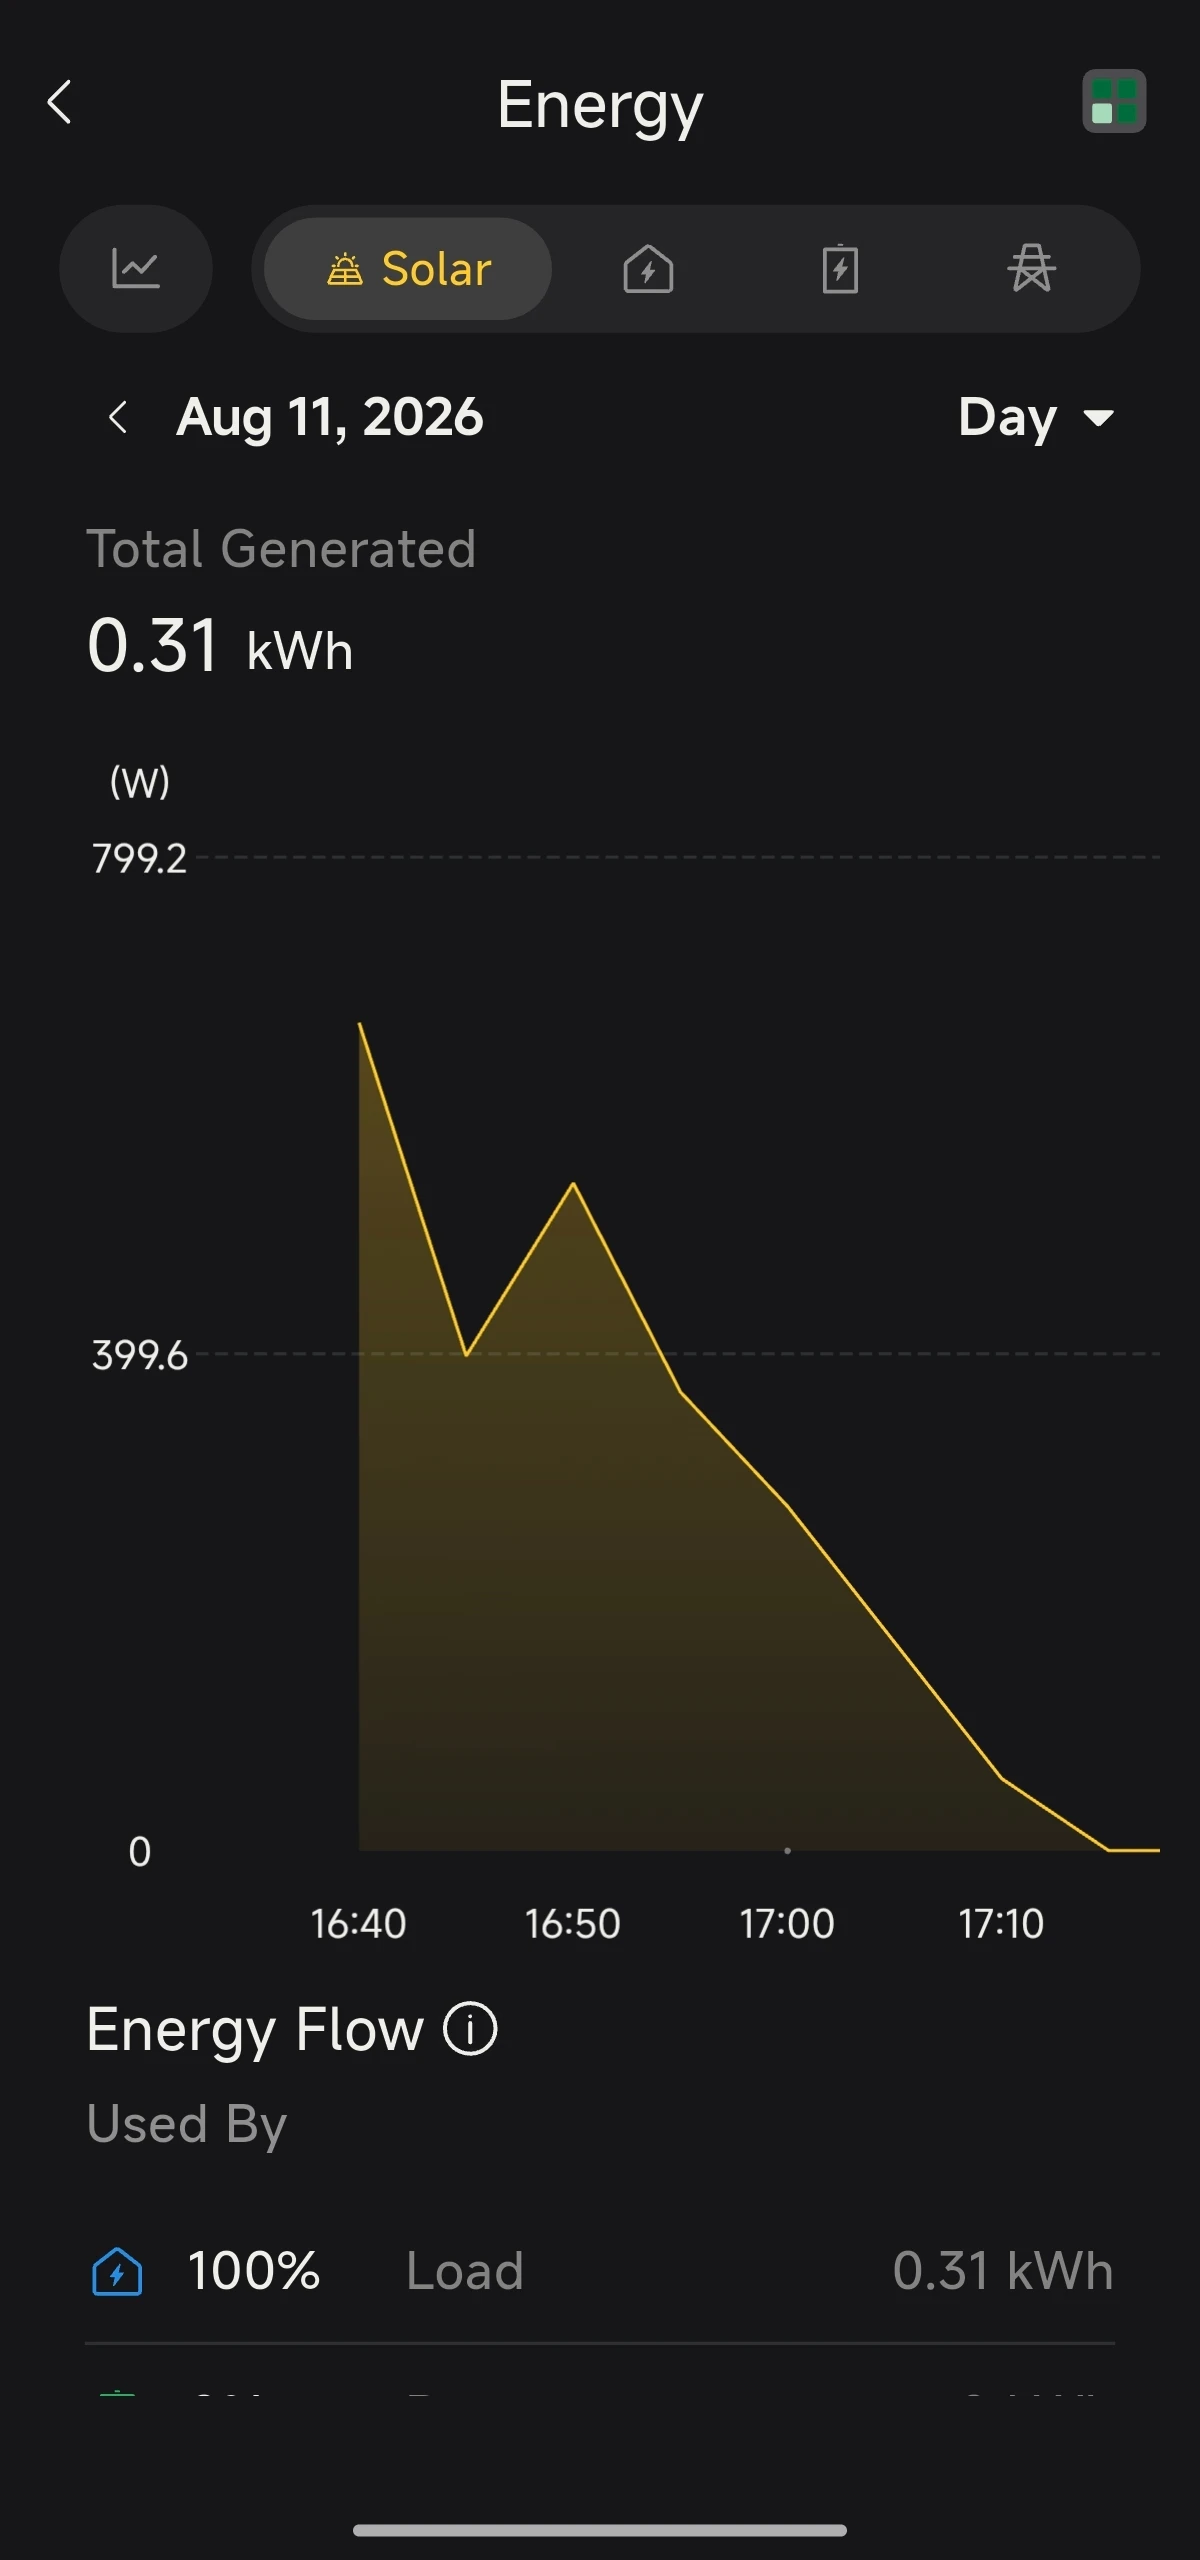
- Switch between the day/month/year energy data for each metric, such as installed PV, home load, battery and grid.
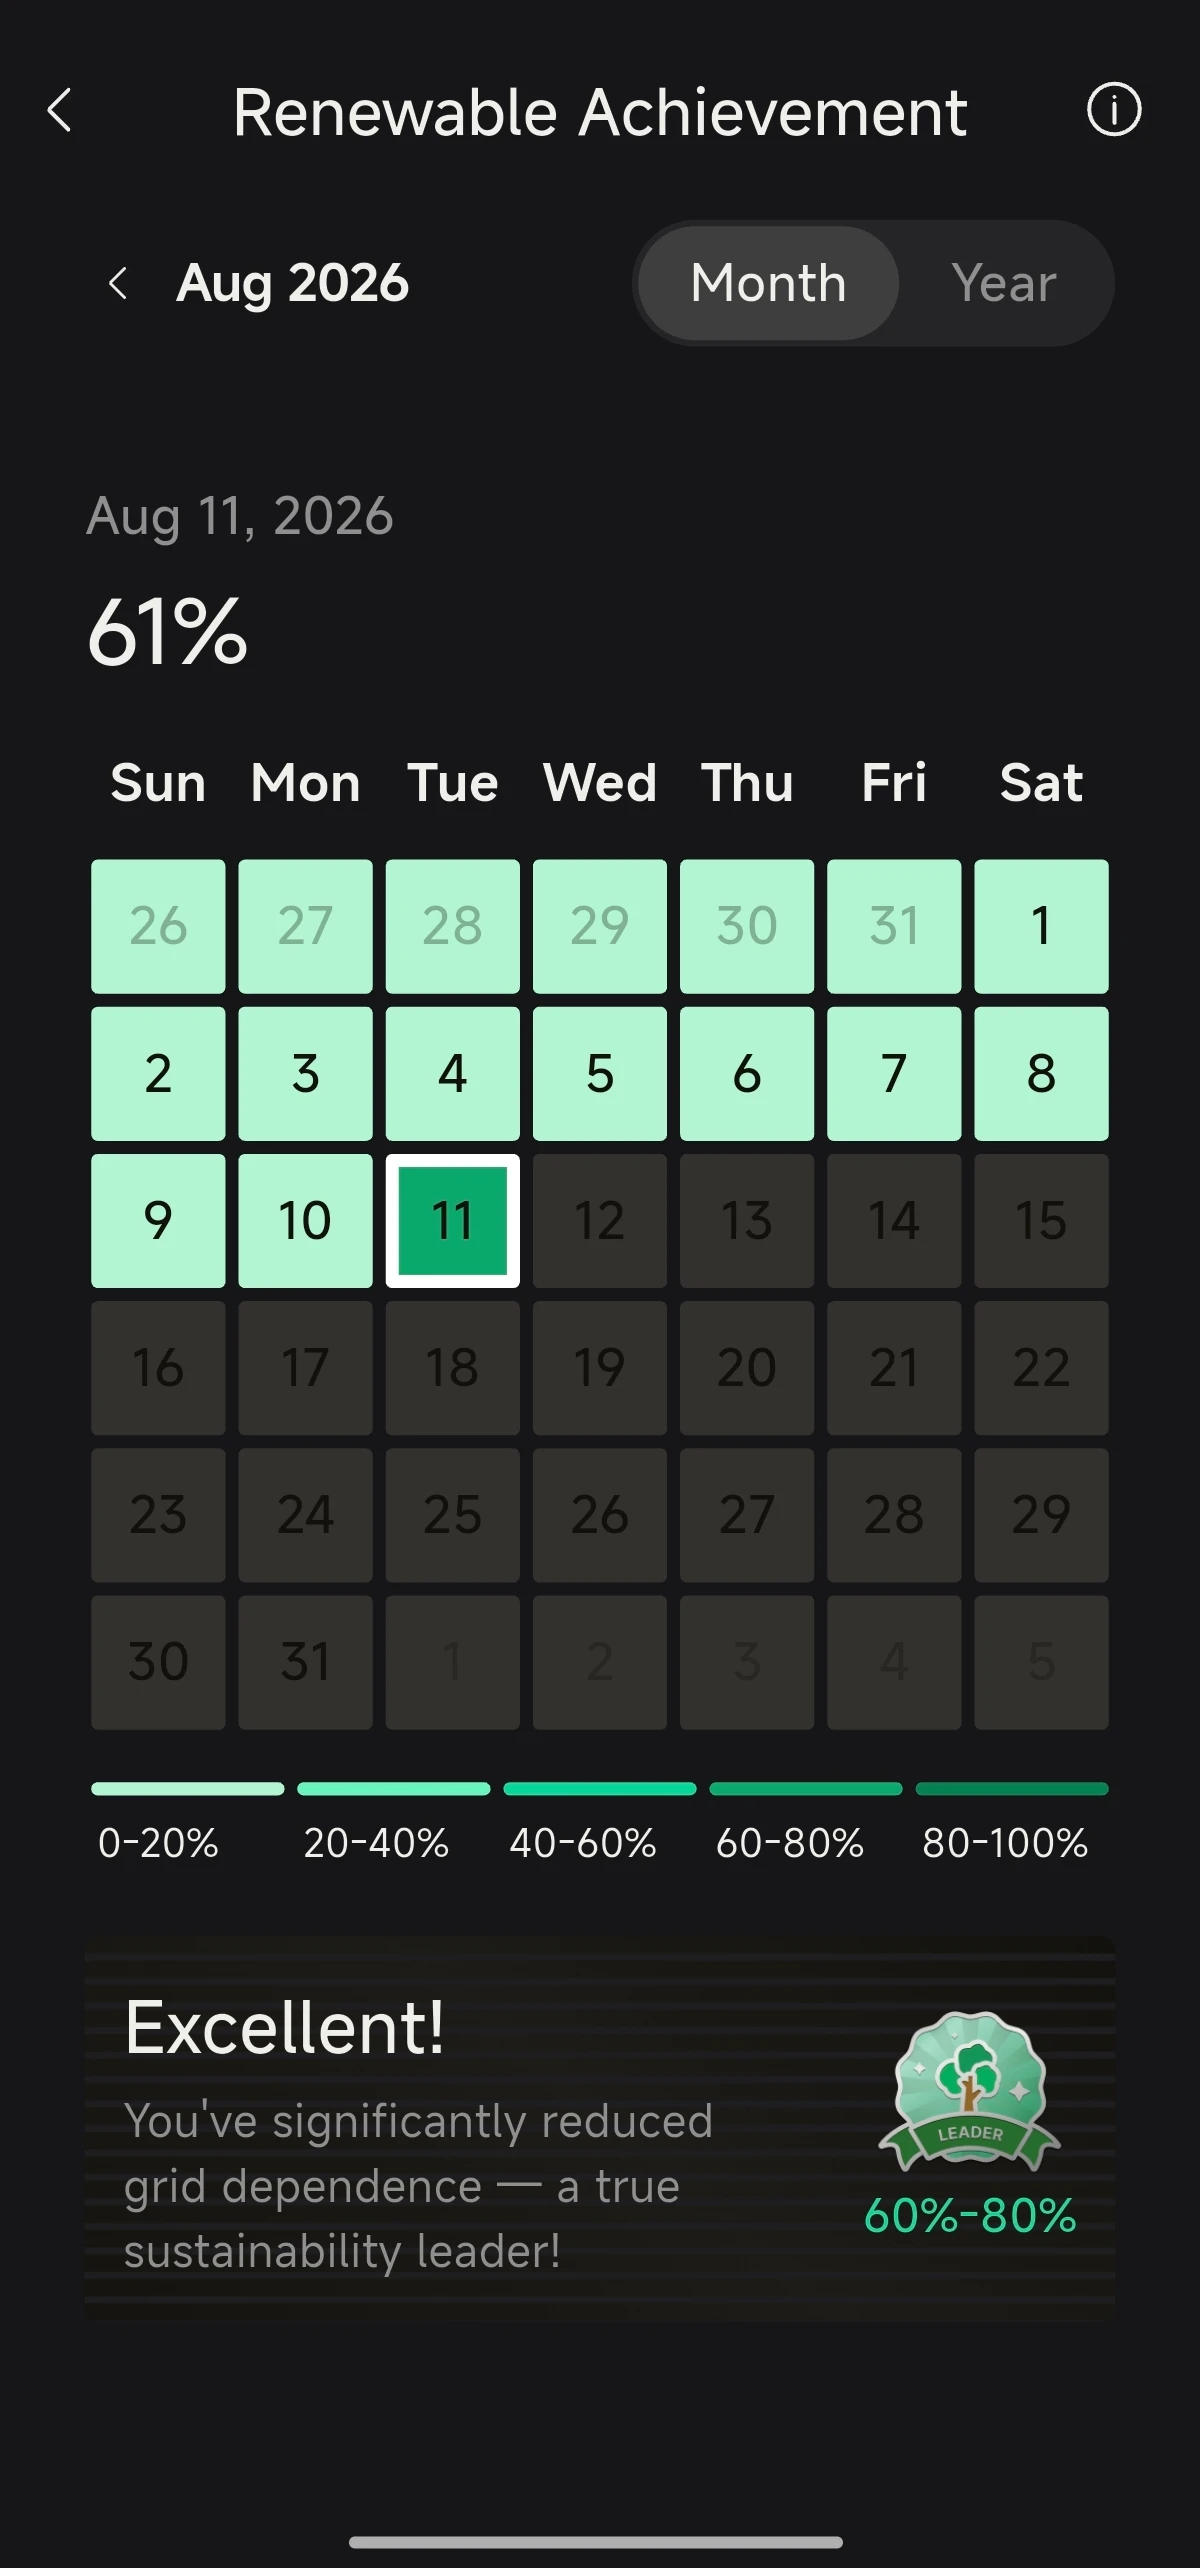
- View the site's renewable energy achievement data.