

Installation and Commissioning Manual
Login Page

Please open the login page in your browser: https://cni.alphaess.com/login/
Enter your username and password on the login page and click the Login button. The system will automatically redirect you to the home page.
If the login fails, the page will show "Incorrect username or password". Please check that your details are correct and try again.
If you do not yet have an account, click the Register button to open the registration page and complete the account registration.
If you have forgotten your password, click the password recovery button on the login page and follow the on-screen instructions to reset it.
Data centre selection: on the login page, please pay attention to the "Switch data centre" setting: if you are located in Europe, select "Overseas Node"; if you are located outside Europe, select "Smart Node". Selecting the correct data centre helps ensure stable system access and a better user experience.
Registration
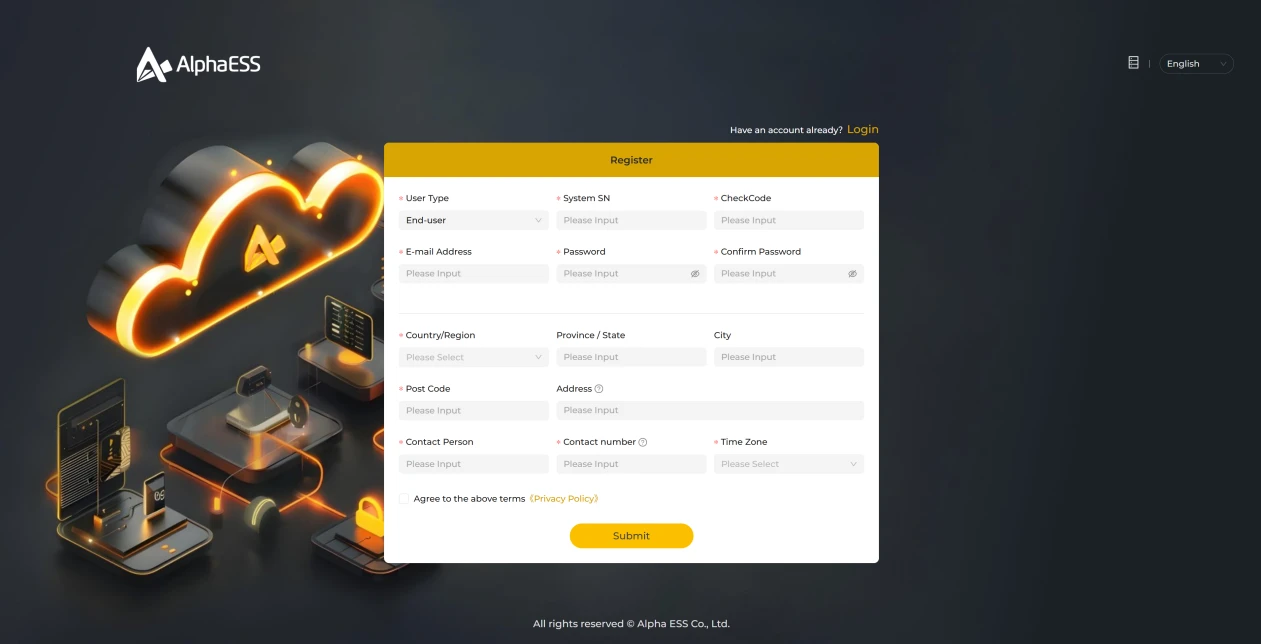
Fields marked with "*" are mandatory; please complete them as prompted.
Please contact the Alpha team first to obtain a system licence; if you already hold a valid licence, you can skip this step. Please provide accurate registration details. For the time zone, select the one corresponding to your current location so that the system time and related functions work correctly. If the page language does not suit you, you can switch it in the top right-hand corner of the page. Chinese, English and German are currently supported.
Data centre selection: during registration, please pay attention to the "Switch data centre" setting: if you are located in Europe, select "Overseas Node"; if you are located outside Europe, select "Smart Node". Selecting the correct data centre helps ensure stable system access and a better user experience.
Password Recovery
Enter your email address on the page and click Get verification code (see Figure 1.2.1 below). The system will send an email containing the password recovery verification code to that address (see Figure 1.2.2 below).
Open your mailbox, enter the verification code from the email and click Next to open the password change page (see Figure 1.2.3 below).
Enter the new password and the confirmation password in the corresponding fields and click Submit to complete the password recovery.
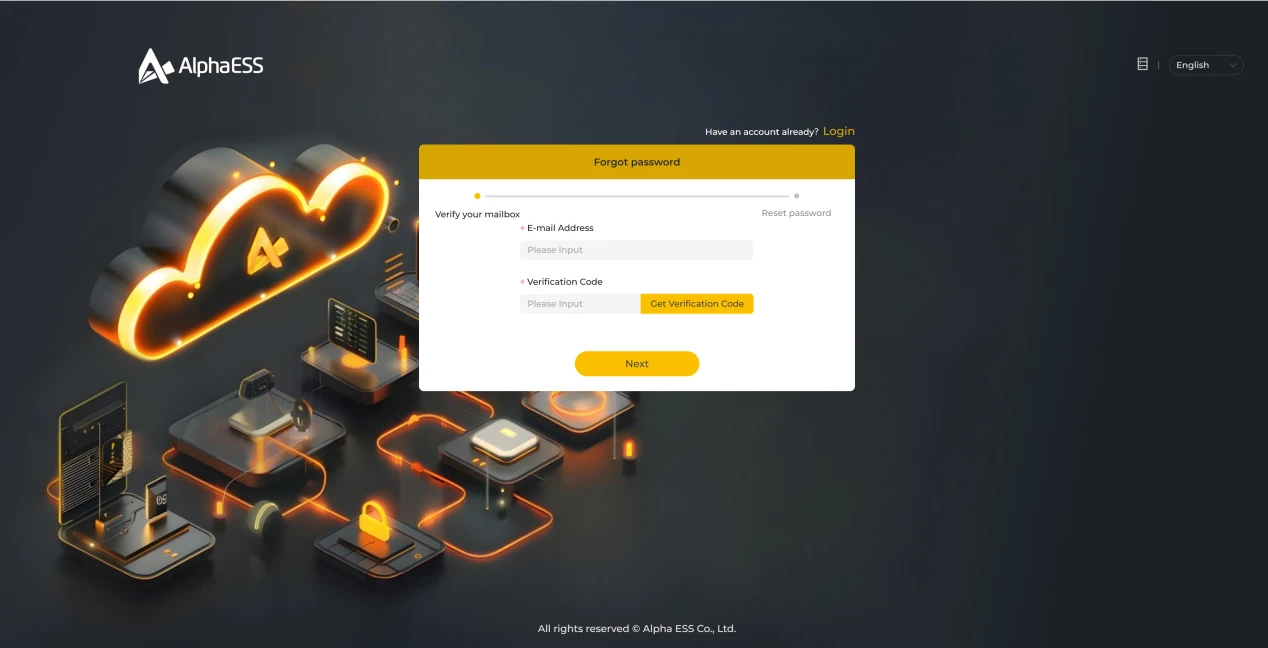
Figure 1.2.1
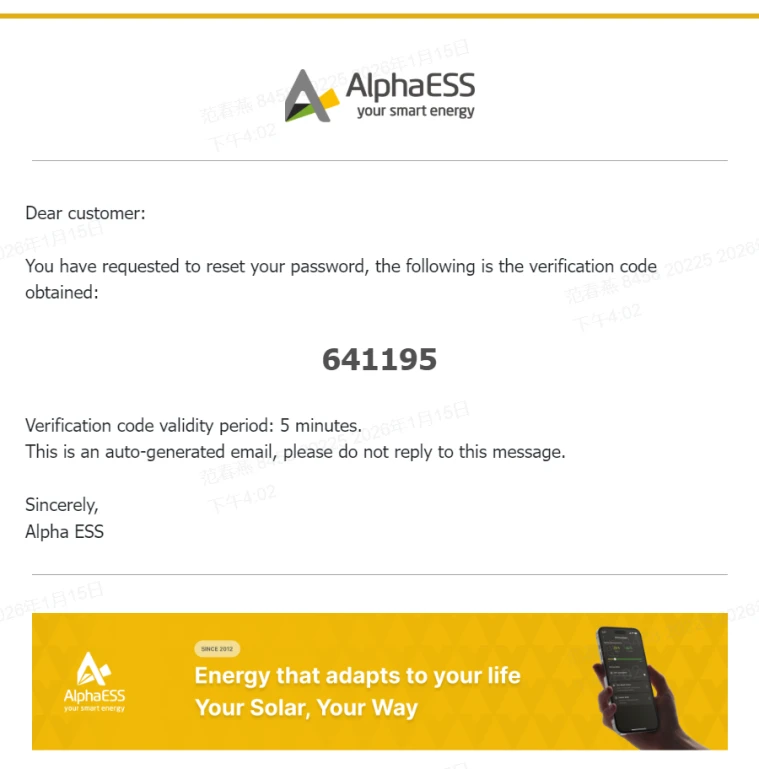
Figure 1.2.2
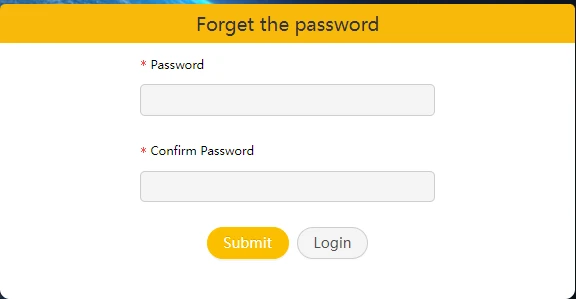
Figure 1.2.3
Home Page
Summary Information
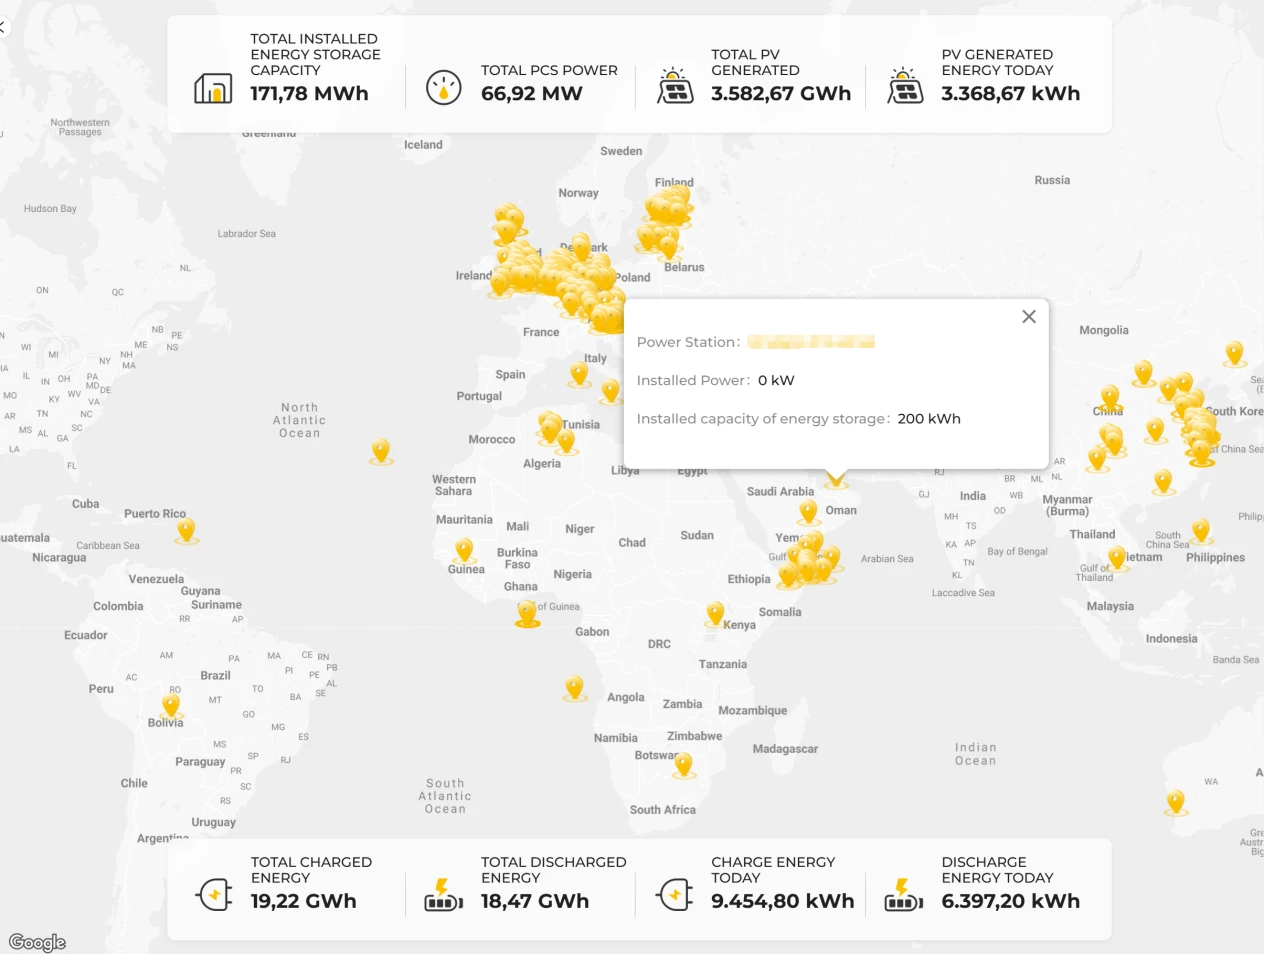
The summary information page shows the overall operating status of all plants bound to the installer's account. The system automatically compiles and aggregates the relevant data based on the licence.
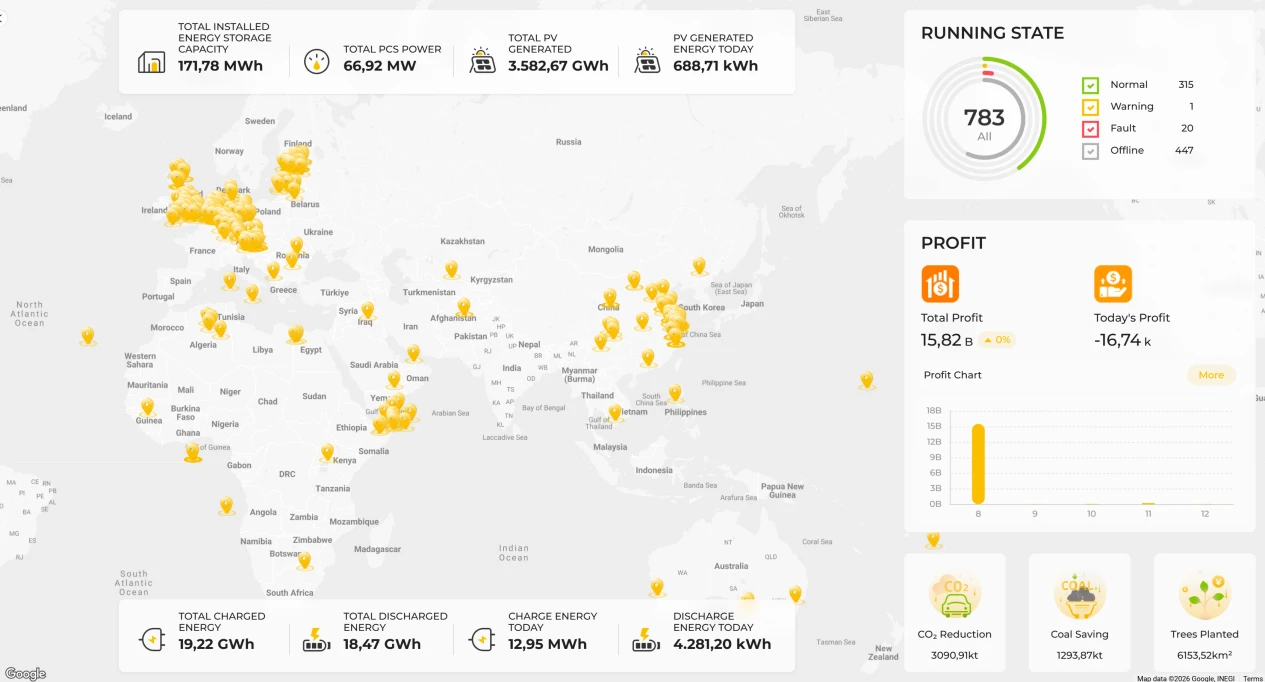
The individual indicators are explained below:
Total installed storage capacity: the sum of the total battery capacities entered under "Plant basic information" for all plants.
Total PCS power: the sum of the installed PCS power entered under "Plant basic information" for all plants.
Total PV generation: the combined total of the PV generation counted by the PCS and the cumulative generation of the PV grid-connected inverters across all plants.
PV energy today: the combined total of today's PV generation counted by the PCS and today's generation of the PV grid-connected inverters across all plants.
Refer to the figure below for the page layout.

Total battery charge / total battery discharge: the cumulative battery charge and discharge energy counted by the system since the date the equipment was installed.
Battery charge today / battery discharge today: the battery charge and discharge energy counted by the system for the current day.

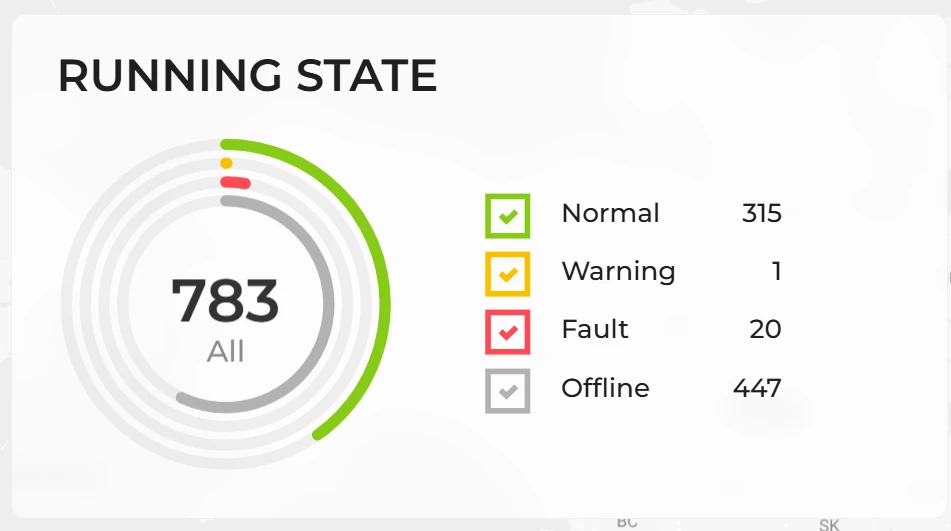
Plant equipment has four operating states in the system, helping you understand the current condition of the equipment at a glance:
Normal: the equipment is operating normally and all functions are working correctly.
Alarm: the equipment has reported an advisory abnormality. Basic operation is not yet affected, but we recommend checking the details promptly.
Fault: the equipment has an abnormality or fault that may affect normal operation. We recommend contacting your service or after-sales personnel as soon as possible.
Offline: the equipment is not currently connected to the platform and the platform cannot retrieve its data.
Refer to the figure below for the page layout.
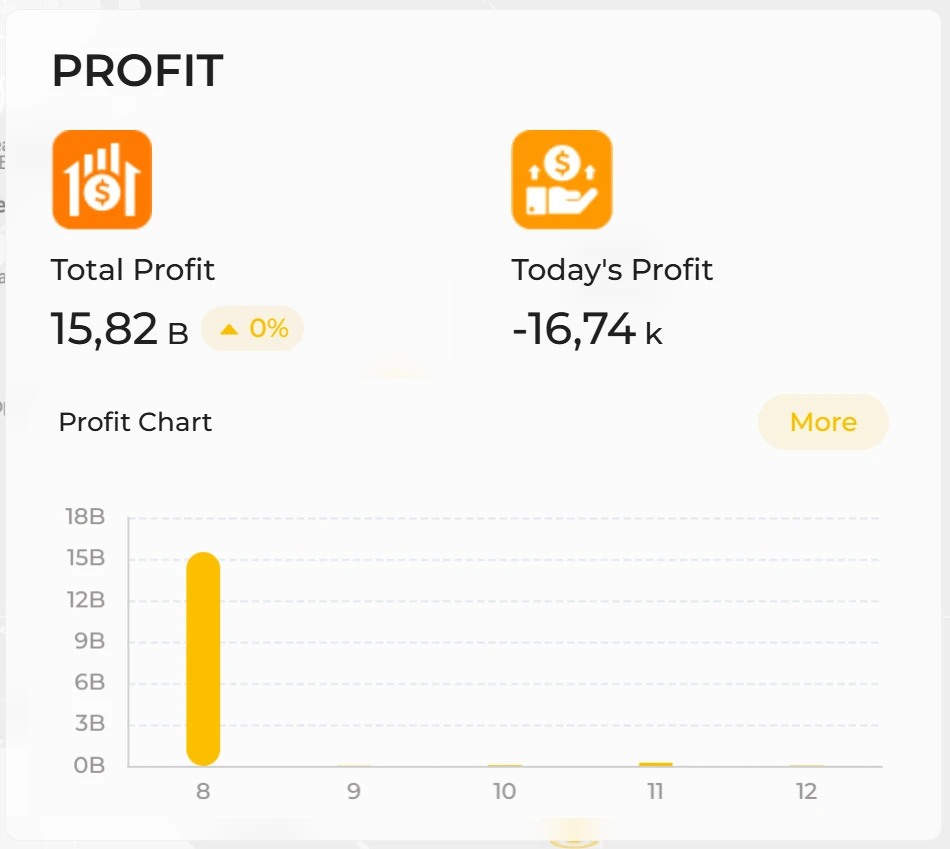
Profit summary shows the overall profit of all plants under the current account.
The page shows the cumulative profit and today's profit, so you can quickly assess the overall financial performance of your plants. The profit chart below presents profit trends over different periods in a clear, visual way for easy comparison.
For more detailed profit data and statistical analysis, click the "More" button in the top right-hand corner of the page to open Statistical Analysis → Profit Report and view detailed profit information by time period.
Refer to the figure below for the page layout.
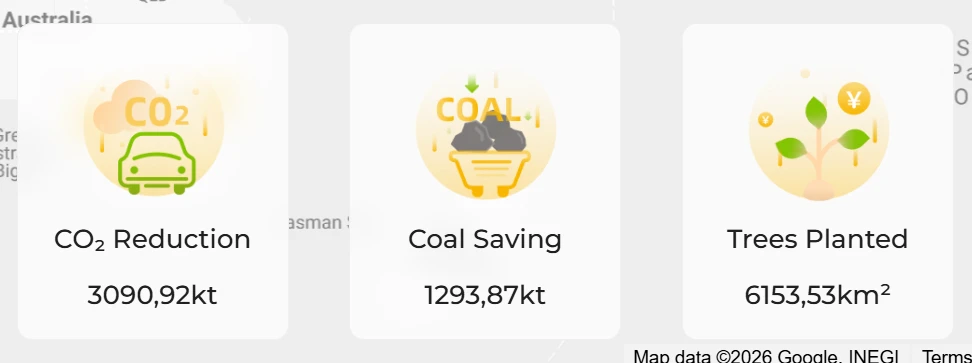
Environmental indicators show the environmental benefits delivered by using the system, specifically:
CO2 reduction: the cumulative reduction in carbon dioxide emissions since the system was commissioned.
Coal saved: the cumulative amount of coal saved since the system started operating.
Equivalent trees planted: the equivalent number of trees planted, calculated from the emissions saved since the system came into use.
Refer to the figure below for the data display.
Map
All bound plants are shown as markers on the map.
Click any marker to open the plant information panel, where you can view detailed information about that plant.
For a more detailed plant overview, click the "Power Station" button on the panel to jump to the plant overview page and view all of the plant's information.
Plant Overview
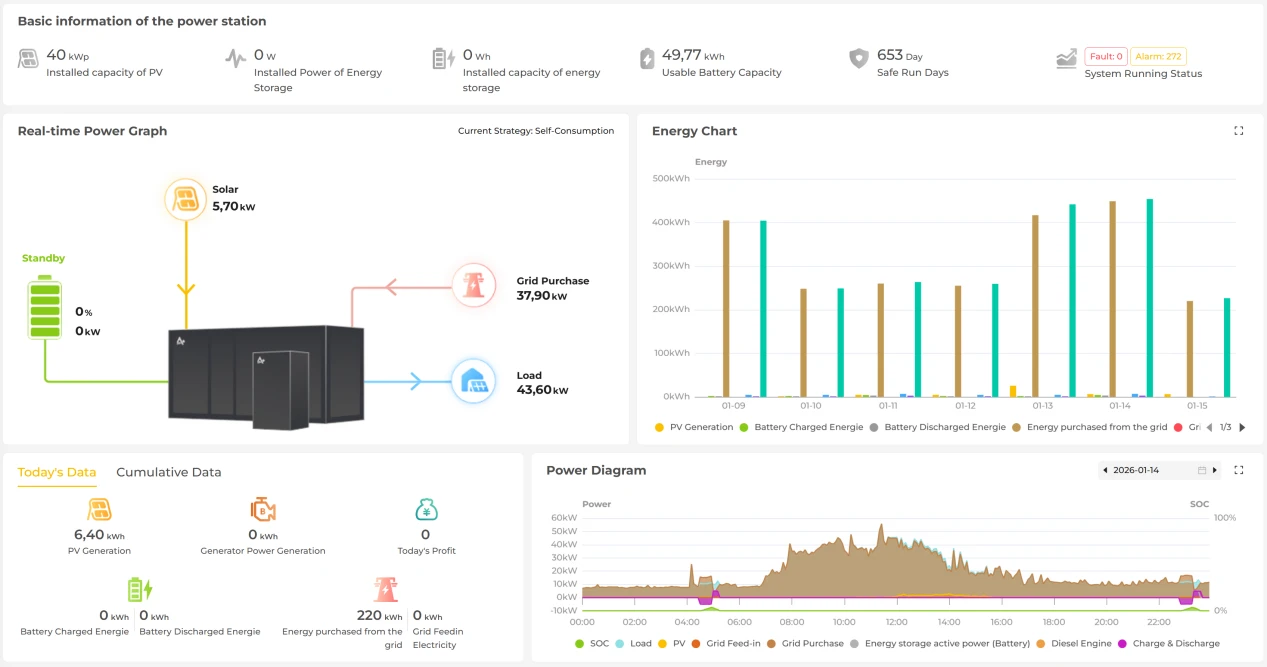
The plant overview page provides the real-time operating status and detailed statistics of the plant, helping you quickly assess overall performance and energy efficiency. The page mainly consists of the following sections:
Plant basic information: shows the plant's basic configuration data, such as installed PV capacity, installed storage capacity and system operating status.
Real-time power diagram: shows the plant's current power flows, including PV generation, battery discharge, load power and energy purchased from the grid.
Energy statistics chart: shows electricity generation and consumption over different periods. The chart lets you clearly see the energy flows for the battery, grid, load and PV generation.
Today's data: PV generation, battery charge, battery discharge, energy purchased from the grid and more, presenting each energy figure for the current day in detail.
Cumulative data: shows cumulative PV generation, battery charge and discharge, grid energy and so on since installation.
Power chart: shows the plant's operating power over different periods, including PV power, load power, storage power and grid energy, helping you understand the plant's real-time operating condition.
Device Monitoring
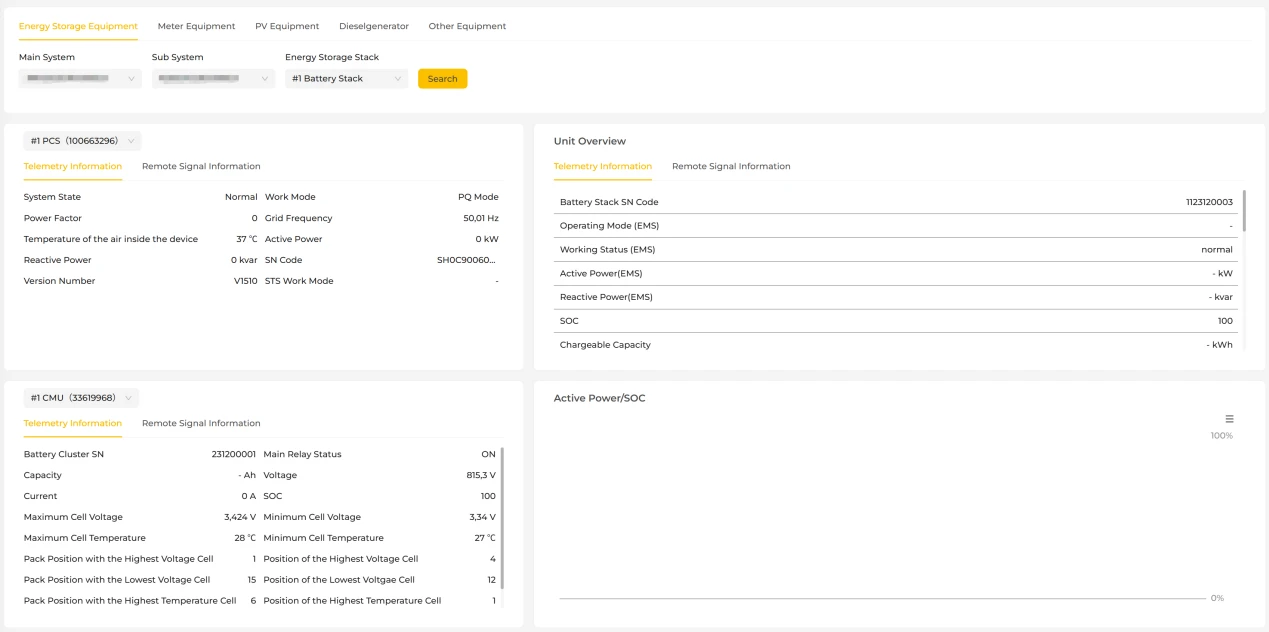
The device monitoring page provides detailed information on all devices bound to the plant. Here you can view the operating status and data of each device in real time to make sure the plant's equipment is running correctly.
Display rules: the system shows sections according to the device types actually installed and connected at the customer's plant. If the plant has no PV equipment, the "PV equipment" section is not displayed; if the plant has no diesel generator, the "Diesel generator" section is not displayed.
The page is divided into the following main sections: storage equipment, meters, PV equipment, diesel generator and other equipment.
Storage equipment: this section shows the real-time data and status of the energy storage system equipment in the plant, including inverter telemetry and telesignalling data, the operating status of each storage module, charge and discharge data and more.
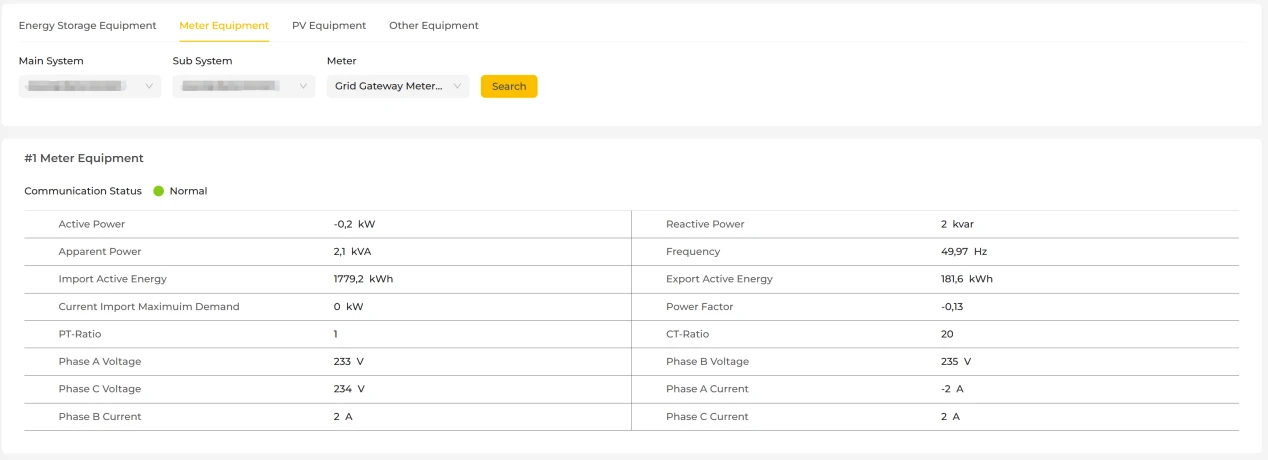
Meters: this section shows data from the gateway meter and metering meters in the plant.
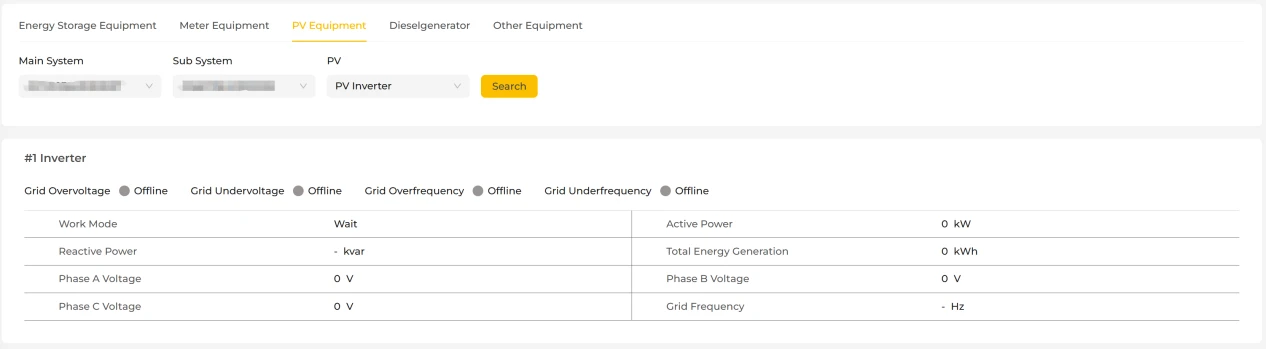
PV equipment: this section is shown for plants with PV equipment and displays data related to the PV inverters in the plant.
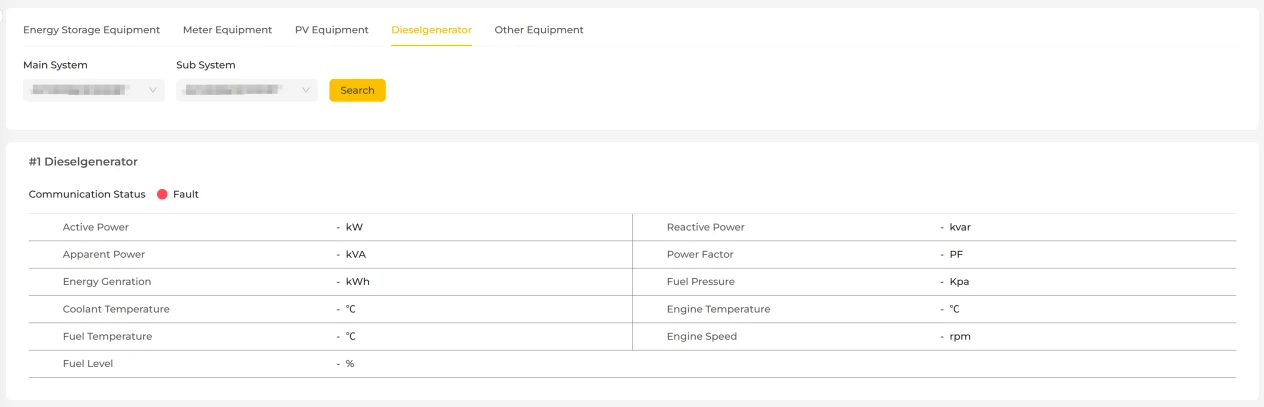
Diesel generator: this section is shown for plants with a diesel generator and displays the related generator data.
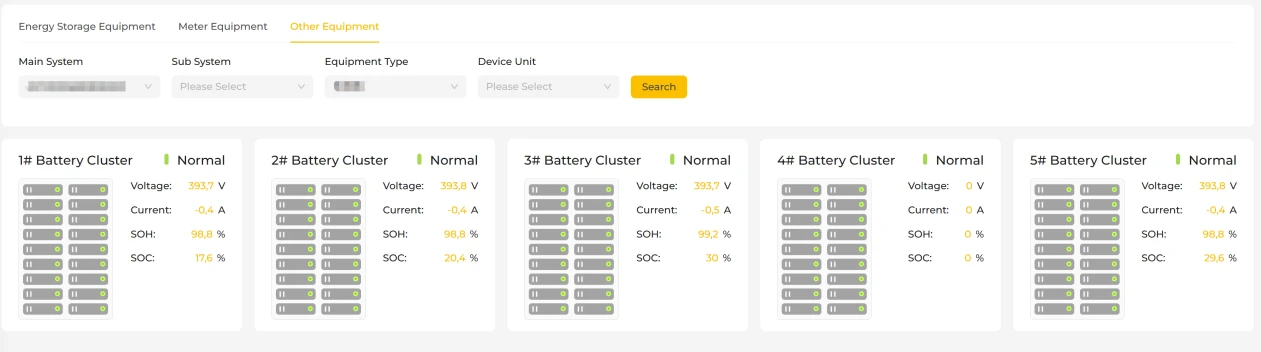
Other equipment: shows data for equipment such as battery stacks, dehumidifiers and thermal management units.
Statistical Analysis
Curves
The curves page contains two parts: plant power curves and device curves.
Power curves
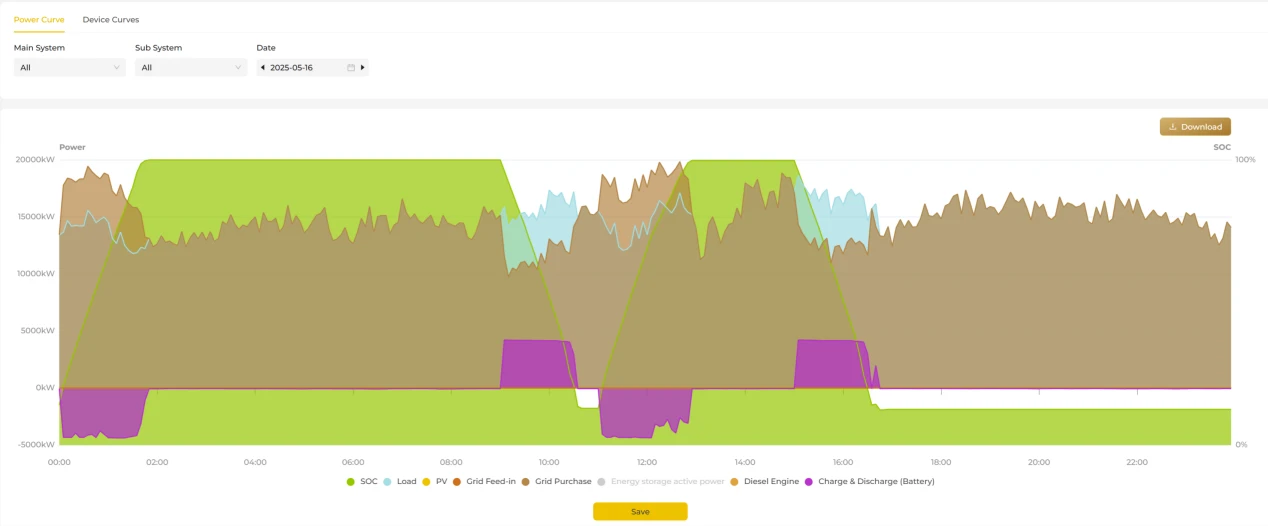
The power curves page shows how the system has operated over a day, helping you understand energy changes at a glance. On this page you can view the key operating data of each subsystem, including SoC, load power, grid feed-in power and more. All data is recorded and displayed at a 5-minute granularity, giving a fairly detailed picture of how the system behaves over the course of a day.
Device curves
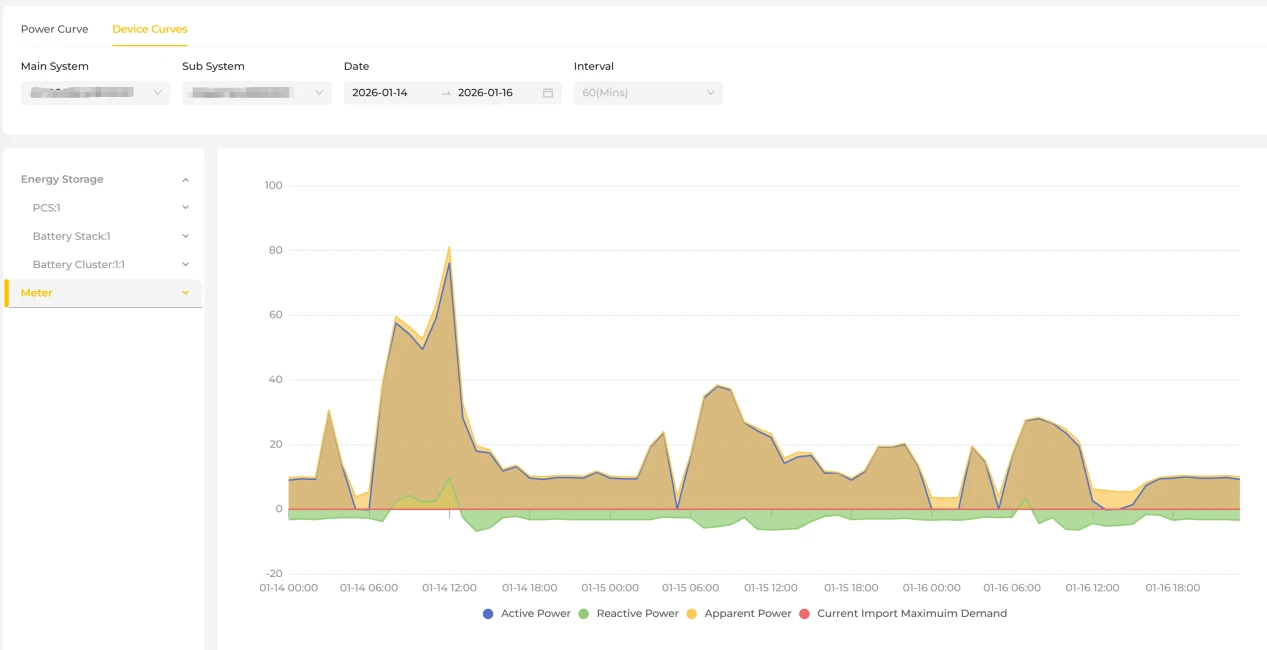
This page mainly shows the performance data of the energy storage system over a specific period. It lets you view the operating status and power data of the various system components (such as the PCS, battery, meters and PV modules). You can select different "main systems" and "subsystems" to view.
The date picker lets you set the time range of the data to view; the range must be no more than 3 days.
The menu on the left of the page lists the various device components, such as the PCS, battery and PV equipment. Select different components to view their power and status data over the selected period. The selected devices are highlighted in the chart for easy comparison and analysis.
Reports
The reports page shows the profit report and operation report for the whole plant.
Profit report
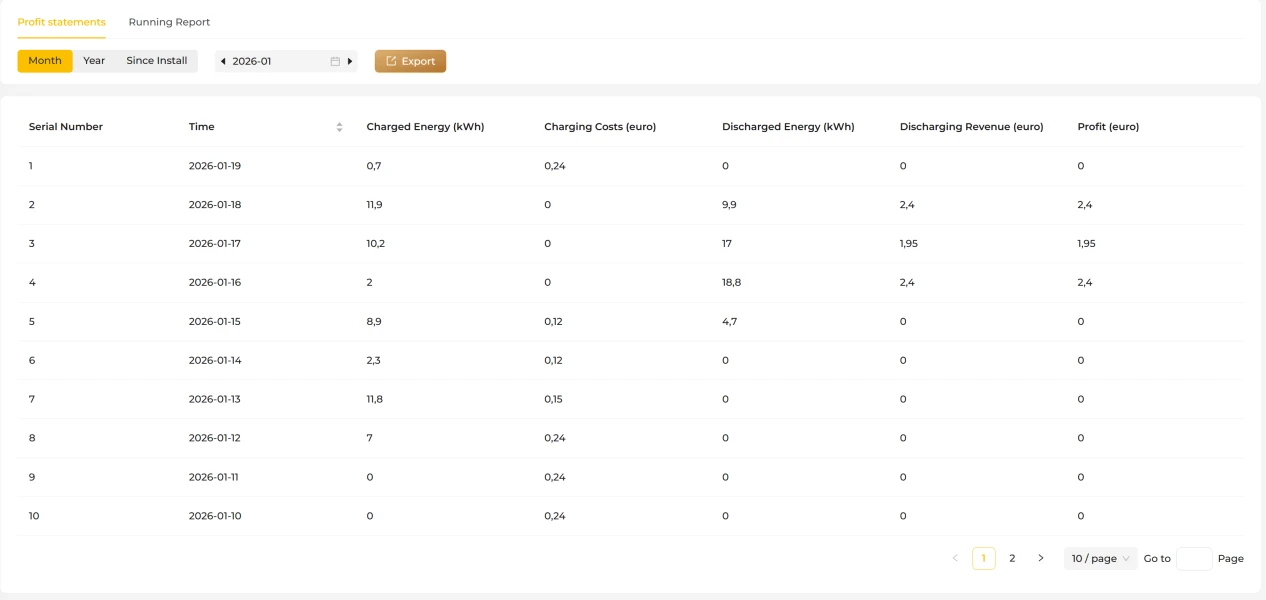
The profit report page shows the plant's profit across different time periods, helping you clearly understand the financial performance of the energy storage system.
The page supports three time views — monthly, yearly and since installation — and can compile and display the following data: charged energy, charging cost, discharged energy, discharge revenue and profit. By switching between time views you can compare performance across periods, which is useful for operational analysis and cost assessment. The page also supports data export, so you can export the current report data for local storage, reconciliation or further analysis.
Operation report
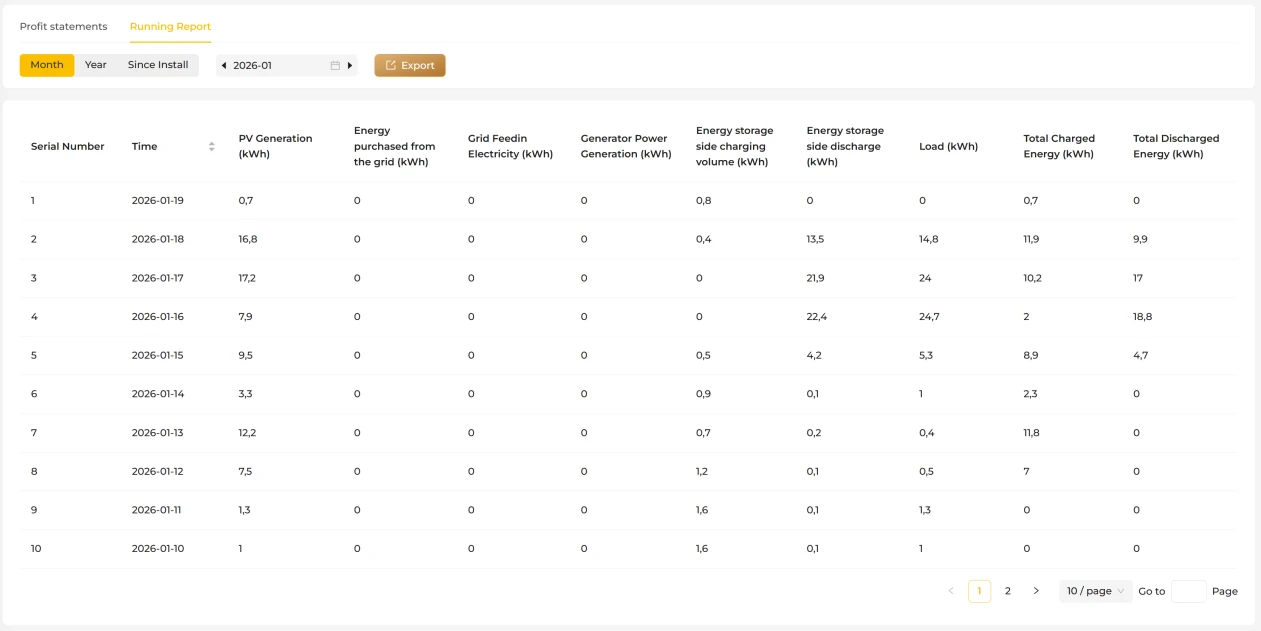
The operation report page shows the plant's operating data over different time ranges, giving you a complete picture of energy use at the plant.
The page supports three time views — monthly, yearly and since installation — and can compile and display the following operating data: PV generation, energy purchased from the grid, energy fed into the grid, diesel generator output, storage-side charged energy, storage-side discharged energy, load, total charged energy and total discharged energy.
By switching between time views you can compare operation across periods directly, making it easier to analyse the plant's energy mix and operating performance. The page also supports data export, so you can export the current report data for local storage, data analysis or reporting.
Faults and Alarms
The faults and alarms page shows the real-time and historical faults occurring at the current plant.
Real-time faults
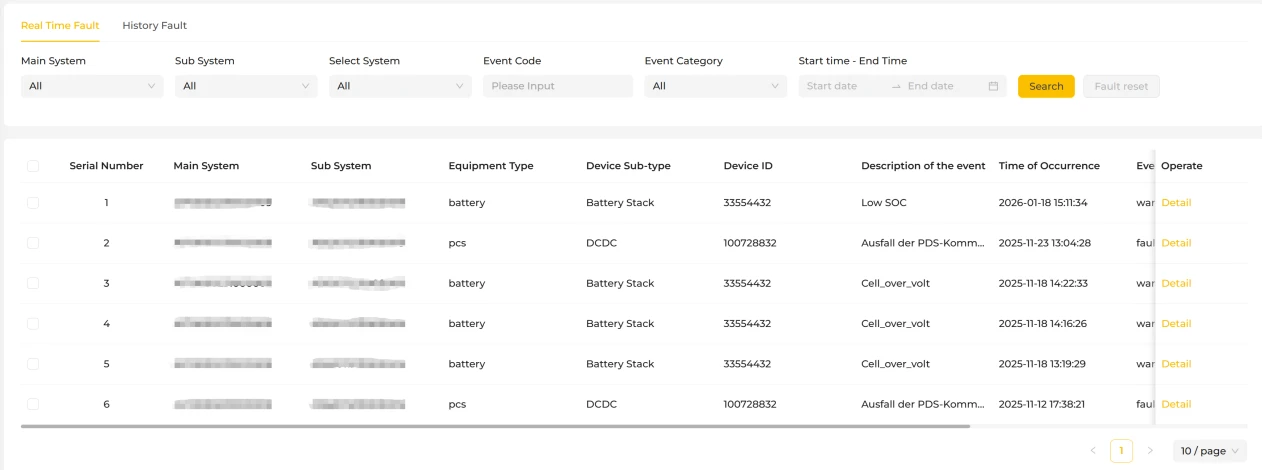
The real-time faults page shows the alarms and faults currently occurring at the plant, helping you keep track of equipment abnormalities promptly and monitor the plant's operating status. The page offers a range of filters — by main system, subsystem, device, event code, event category and time range — so you can quickly locate the fault information you are interested in.
Historical faults
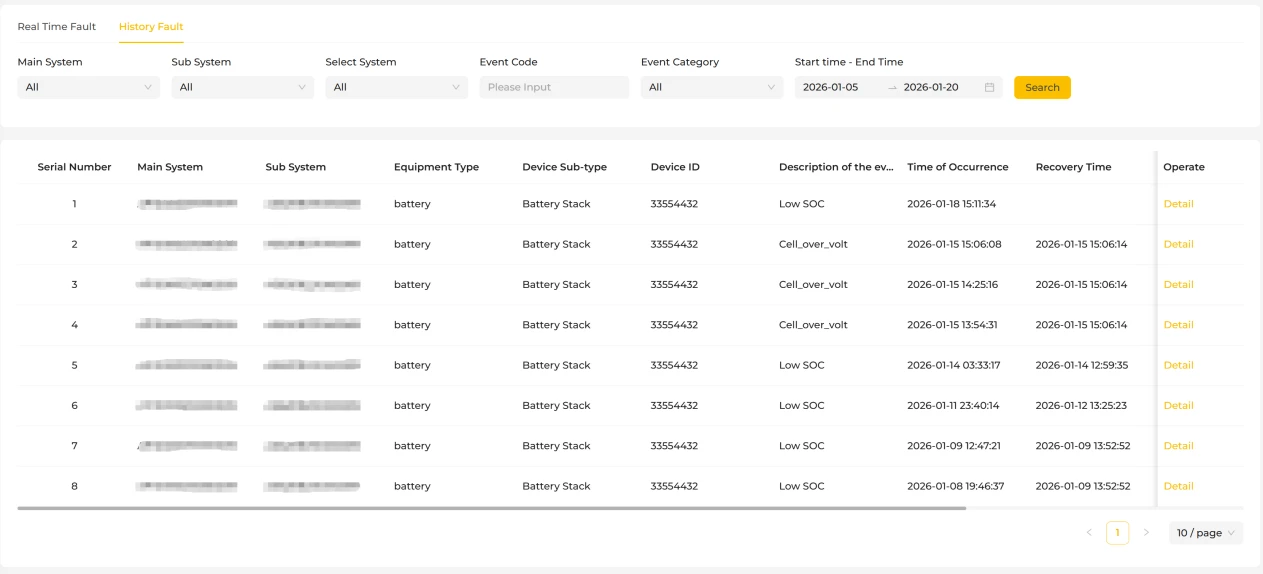
The historical faults page shows alarm and fault records generated during past operation of the plant, supporting retrospective analysis and maintenance management.
The page supports filtering by main system, subsystem, device, event code, event category and time range, so you can quickly query historical faults for a specific period or device and gain a complete picture of every fault occurrence.
Operation and Maintenance
Parameter Settings
Control Strategies
Basic Settings
If the start-up mode is set to "Passive mode", the equipment is controlled centrally by the local EMS. Once the parameters have been configured, the system runs the relevant control strategies automatically without manual intervention.
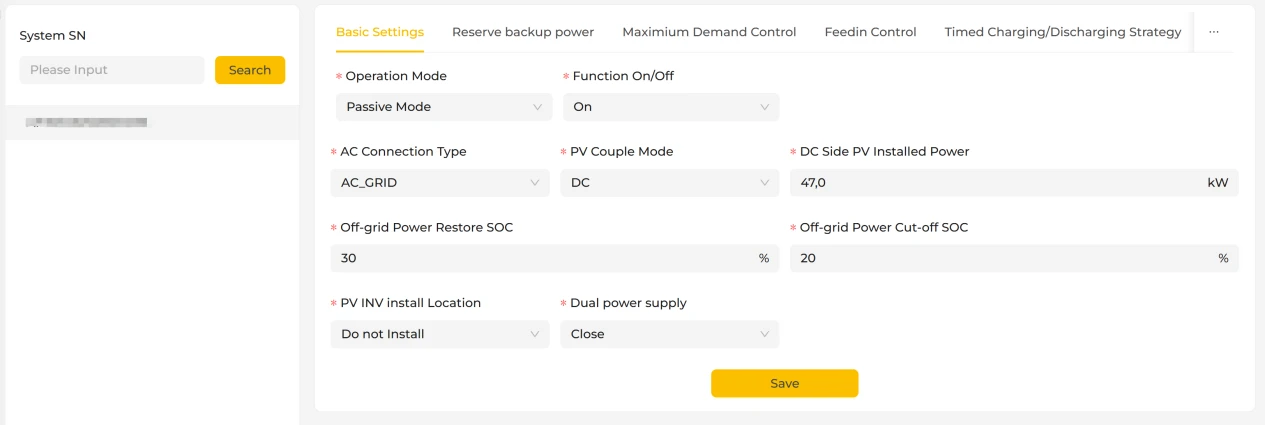
If the start-up mode is set to "Third-party dispatch mode", the equipment is connected to and dispatched by a third-party platform, and the system is then controlled centrally by that third party. Only the parameters for tariff settings, UPS reserve, demand control, export limitation, transformer protection, off-grid operation and grid-connected/off-grid start-up are retained in the control strategies, to avoid conflicts with third-party dispatch. Local mode: in local mode, you can set power parameters via the cloud platform page or the device's local web page. This mode is mainly used during installation and commissioning, allowing quick on-site configuration and verification. Remote mode: in remote mode, you establish a connection via the EMS physical communication interface and issue control commands over that interface, enabling remote control and dispatch of the equipment.
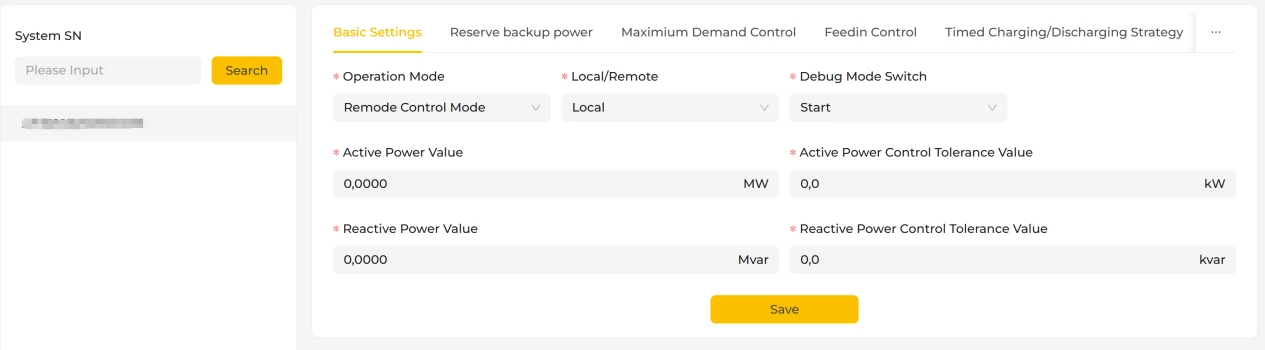
Field descriptions:
| Field name | Value range | Description |
|---|---|---|
| Start-up mode | Drop-down options: Passive mode, Third-party dispatch mode | -- |
| Local/Remote | Drop-down options: Local, Remote | -- |
| Dispatch interruption control mode | Drop-down options: Hold current value, Zero power output | -- |
| Dispatch protocol | Drop-down options: MODBUS-TCP, IEC104, SunSpec | -- |
| Active power setpoint (MW) | Value range: -99999.9999~99999.9999 | -- |
| Active power control dead band (kW) | Value range: 0~99999.9 | -- |
| Reactive power setpoint (Mvar) | Value range: -99999.9999~99999.9999 | -- |
| Reactive power control dead band (kvar) | Value range: 0~99999.9 | -- |
| AC connection type | Drop-down options: AC_GRID, AC_GENERATOR | -- |
| DC/AC coupling mode | Drop-down options: AC, DC, Hybrid | -- |
| Off-grid supply recovery SOC (%) | Value range: 5-100 | -- |
| Off-grid supply cutoff SOC (%) | Value range: 5-100 | -- |
| Installed AC-side PV power (kW) | Value range: 0-99999.9 | -- |
| Installed DC-side PV power (kW) | Value range: 0-99999.9 | -- |
| PV INV installation position | Drop-down options: Not installed, Grid side, STS load side | -- |
Tariff Settings
Tariffs can be configured by month and by time period.
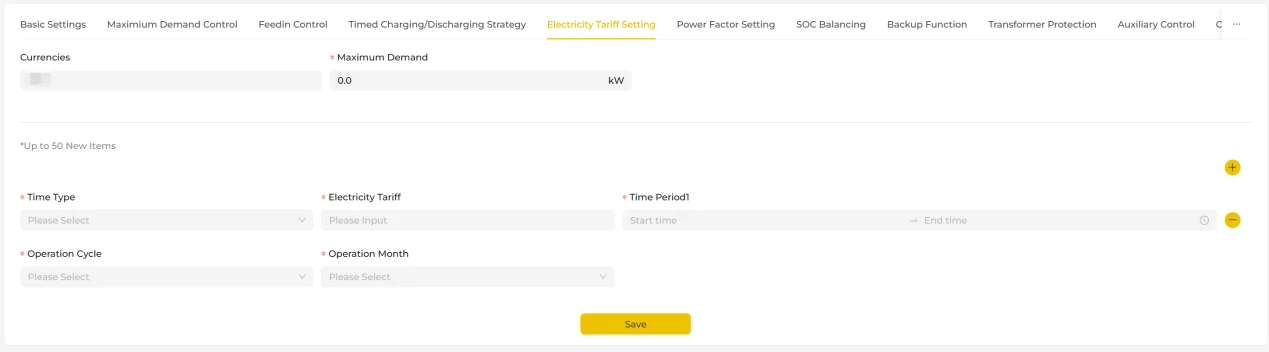
Field descriptions:
| Field name | Value range | Data precision | Description |
|---|---|---|---|
| Demand charge (CNY/kW·month) | Value range: 0~99999.999 | Three decimal places | The "Demand charge" field is displayed when the device is located in China |
| Time type | Drop-down options: Critical peak, Peak, Shoulder, Valley, Deep valley | -- | -- |
| Tariff | -- | Three decimal places | -- |
Three-Phase Imbalance Control
Function overview
Three-phase imbalance control is used where the load is unevenly distributed across the three phases. It regulates the storage PCS on a per-phase basis according to the configured single-phase current or power limits, so as to keep the three-phase currents or power at the grid connection point (service entrance) as balanced as possible and within the limits, ensuring stable system operation. This function can only charge or discharge on all phases together.
Once three-phase imbalance control is enabled, the system regulates the PCS per phase according to real-time operating conditions, without affecting normal electricity use or production.
What the function does:
- Monitors three-phase current and power status in real time;
- Controls to the configured single-phase current or power limits, easing single-phase overload.
This function helps customers with the following:
- Reduces the risk of single-phase overload and abnormalities;
- Improves three-phase imbalance, safeguarding electrical safety;
- Automatic regulation with no manual intervention required.

Note: the content shown on the three-phase imbalance page varies by equipment model. The field descriptions here cover all fields across the different versions of the three-phase imbalance page.
Field descriptions:
| Field name | Value range | Data precision | Description |
|---|---|---|---|
| Parameter setting | Drop-down options: Single-phase current, Single-phase power, Total gateway power | -- | Supports parameter settings in three different modes: single-phase current, single-phase power and total gateway power. |
| Phase A current (A) | Value range: 0-65535 | Integer | Limits the maximum current on phase A at the grid connection point. Set this according to the rated current of the on-site circuit breaker or switch; the value entered must not exceed the maximum single-phase current allowed by the breaker, to avoid overcurrent and protection trips. |
| Phase B current (A) | Value range: 0-65535 | Integer | Limits the maximum current on phase B at the grid connection point. Set this according to the rated current of the on-site circuit breaker or switch; the value entered must not exceed the maximum single-phase current allowed by the breaker, to avoid overcurrent and protection trips. |
| Phase C current (A) | Value range: 0-65535 | Integer | Limits the maximum current on phase C at the grid connection point. Set this according to the rated current of the on-site circuit breaker or switch; the value entered must not exceed the maximum single-phase current allowed by the breaker, to avoid overcurrent and protection trips. |
| Phase A active power (kW) | Value range: 0-99999.9 | One decimal place | Limits the maximum active power allowed on phase A at the grid connection point. Set this according to the capacity of the on-site circuit breaker or switch; the power value entered should not exceed the maximum power the breaker can carry on a single phase, to avoid protection trips caused by exceeding the limit. |
| Phase B active power (kW) | Value range: 0-99999.9 | One decimal place | Limits the maximum active power allowed on phase B at the grid connection point. Set this according to the capacity of the on-site circuit breaker or switch; the power value entered should not exceed the maximum power the breaker can carry on a single phase, to avoid protection trips caused by exceeding the limit. |
| Phase C active power (kW) | Value range: 0-99999.9 | One decimal place | Limits the maximum active power allowed on phase C at the grid connection point. Set this according to the capacity of the on-site circuit breaker or switch; the power value entered should not exceed the maximum power the breaker can carry on a single phase, to avoid protection trips caused by exceeding the limit. |
| Total gateway power (kW) | Value range: 0-99999.9 | One decimal place | Limits the maximum active power allowed at the grid connection point overall. Make sure the power value entered does not exceed the total power limit of the gateway circuit breaker, so that the system operates safely. |
| Single-phase current (A) | Value range: 0-65535 | Integer | -- |
Transformer Protection
Function overview
Transformer protection is intended for sites with large load fluctuations, or with several power sources connected at once (such as storage and PV). It automatically regulates the charge and discharge power of the storage system to prevent the power at the grid connection point (service entrance) from exceeding the transformer capacity, reducing the risk of transformer overload. Once transformer protection is enabled, the system automatically adjusts the storage charge and discharge power according to real-time operating conditions, without affecting normal electricity use or production. This function can equally be used where there is no transformer at the grid connection point but an upper limit on the power passing through that point is nevertheless required.
What the function does:
1. When the load suddenly increases, it automatically reduces the storage charging power or switches to discharging, easing the load on the transformer;
2. When the storage system is discharging at high power in combination with other sources, it automatically limits the storage discharge power;
3. It keeps the power at the grid connection point (service entrance) below the safe transformer capacity at all times.
This function helps customers with the following:
- Reduces the risk of transformer overload and tripping;
- Keeps the site operating stably;
- Automatic regulation with no manual intervention required.
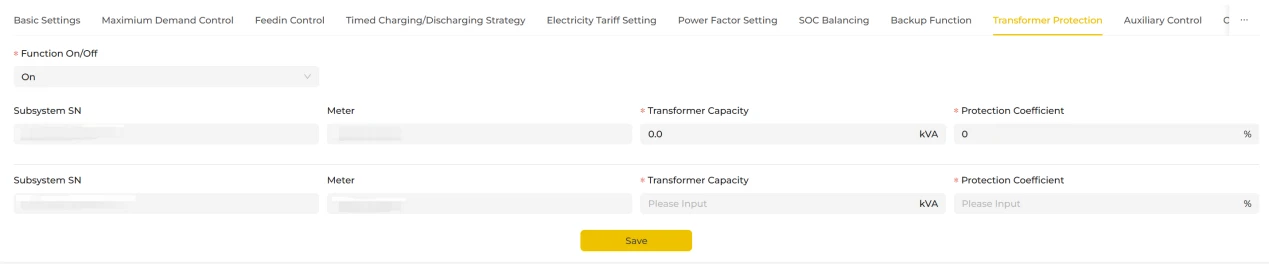
Field descriptions:
| Field name | Value range | Data precision | Description |
|---|---|---|---|
| Protection capacity (kW) | Value range: 0~99999.9 | One decimal place | Sets the rated capacity of the transformer |
| Protection factor (%) | Value range: 0~100 | Integer | Used for actual energy storage system control; maximum transformer throughput capacity = rated transformer capacity * protection factor |
Demand Control
Function overview
When you consume electricity, the grid charges according to the "highest power drawn (demand)". If your power draw suddenly exceeds that highest value at any moment, your bill for the month may increase substantially.
The demand control function helps you manage consumption peaks automatically and avoid exceeding the maximum power draw. The system monitors the power measured by the meter at the point where the plant connects to the grid (gateway / service entrance) in real time — like an electricity monitor watching consumption around the clock.
When the system detects that the current power draw is approaching or exceeding the "maximum allowed demand" you have set in advance, it automatically takes action:
- Discharging the storage battery as a priority to reduce the amount drawn from the grid;
- Where conditions allow, increasing PV output so that more self-generated energy is used.
In this way the power drawn at the grid connection point (service entrance) is kept within the configured range, avoiding additional demand charges caused by momentary high consumption.
What the function does:
- No need for frequent manual parameter adjustments;
- The system automatically adapts the control limit to actual consumption;
- It continuously optimises electricity costs while keeping production running normally.
This function helps customers with the following:
- Prevents sudden power spikes and the high charges that come from exceeding the demand limit;
- Makes fuller use of storage and PV, reducing purchased electricity;
- It can also be used to achieve peak shaving;
- Fully automatic control with no manual supervision required.

Field descriptions:
| Field name | Value range | Data precision | Description |
|---|---|---|---|
| Mode selection | Drop-down options: Demand tracking, Contracted demand | -- | Selecting "Contracted demand" displays "Maximum allowed demand (kW)"; |
| Maximum allowed demand (kW) | Value range: 0~99999.9 | One decimal place | Sets the upper limit for power drawn from the grid. When the meter at the point where the plant connects to the grid (gateway / service entrance) detects that the real-time power draw exceeds this value, the system discharges automatically to avoid exceeding the demand limit. |
| Actual demand (kW) | -- | -- | In practice, some businesses are billed on the basis of real-time demand. |
Export Limitation
Function overview
If the combined PV generation and battery discharge power exceeds the on-site load demand, the surplus flows back into the grid as "feed-in". If the feed-in power exceeds local requirements, this can lead to grid code violations, fines or uncertain returns. The export limitation function helps you avoid this automatically.
The system monitors the power situation at the point where the plant connects to the grid (grid connection point / service entrance) in real time and determines whether there is a tendency to export to the grid. When the system detects that PV generation + battery discharge > actual on-site load — in other words, that reverse power flow to the grid is about to occur or has already begun — it adjusts automatically according to the configured feed-in parameters: reducing the storage discharge power or switching the storage system to charging, and limiting PV output if necessary.
What the function does:
- Automatically prevents surplus energy from being exported to the grid, meeting local grid connection requirements and avoiding penalties or compliance risks from exceeding feed-in limits;
- Through these adjustments, the plant generates just enough to cover on-site consumption without exporting the surplus to the grid.
This function helps customers with the following:
- Prevents reverse power flow to the grid, avoiding penalties or operating risks caused by feed-in;
- Setting the maximum feed-in power to a positive value achieves valley filling;
- Fully automatic control with no manual supervision required.

Field descriptions:
| Field name | Value range | Data precision | Description |
|---|---|---|---|
| Maximum feed-in power setting | Drop-down options: Maximum feed-in power, Maximum feed-in power factor | -- | Selecting "Maximum feed-in power (kW)" displays "Maximum feed-in power (kW)"; |
| Maximum feed-in power (kW) | Value range: -99999.9~99999.9 | One decimal place | Entering a positive value (typical of "zero feed-in" scenarios): where the site does not permit any export to the grid, we recommend setting the maximum feed-in power to a positive value. With this setting, the EMS deliberately controls the power purchased from the grid to equal the configured value, avoiding brief feed-in caused by a sudden drop in load. Entering a negative value (for scenarios where feed-in is permitted): where the site permits export to the grid, the maximum feed-in power must be set to a negative value. The EMS then controls the power fed into the grid so that it does not exceed the magnitude of the configured value. |
| Maximum feed-in power factor (%) | Value range: 0~100 | Integer | Maximum feed-in power = installed PV power * this factor. When the feed-in power detected at the grid connection point exceeds the maximum feed-in power, the system automatically activates export limitation control to prevent the feed-in limit from being exceeded. |
UPS Reserve
Function overview
Where power cuts are possible, you can reserve part of the battery capacity in advance as emergency backup power for the equipment connected to the backup port. During everyday operation and discharging, the system makes sure the remaining battery level does not fall below the "UPS Reserve SOC" you have set, so the emergency reserve is never used up. When the system detects that the current battery level is below the reserved backup level, it automatically starts recharging to top the battery up and keep enough backup energy available. Recharging is carried out at the backup power configured on the page, which keeps the site safe without affecting other electricity requirements.
What the function does:
- Reserves emergency energy in the battery in advance, so that critical loads connected to the backup port continue to be supplied during a power cut;
- During everyday operation, the system automatically limits discharging so the battery level never falls below the reserved backup value, and recharges automatically when the level is too low.
This function helps customers with the following:
- Ensures power is still available during an outage, keeping equipment connected to the backup port running;
- Fully automatic control with no manual supervision required.

Field descriptions:
| Field name | Value range | Data precision | Description |
|---|---|---|---|
| UPS Reserve SOC (%) | Value range: 0-100 | Integer | When the system detects that the battery SoC is below this value, it intelligently starts recharging according to the state of the energy storage system, and stops charging once the battery reaches this SoC. |
| Backup power | Value range: 0~99999.9 | One decimal place | The equipment charges at this power. |
Power Factor Control
Function overview
This function automatically regulates the reactive power output of the storage plant, helping the site maintain a reasonable power factor and reducing power factor adjustment charges. It is suitable for sites with large load fluctuations that risk power factor penalties. Once power factor control is enabled, the system regulates automatically according to site operating conditions, without affecting normal electricity use or production.
What the function does:
- Monitors the site power factor in real time;
- Automatically performs reactive power compensation;
- Keeps the power factor stable within the acceptable range;
- Reduces or avoids power factor adjustment penalties.
This function helps customers with the following:
- The power factor meets requirements, giving a more stable electricity cost structure;
- The system runs automatically with no manual intervention required.

Field descriptions:
| Field name | Value range | Data precision | Description |
|---|---|---|---|
| Target power factor at the grid connection point (cos) | Value range: -1.00~1.00 | Two decimal places | Sets the power factor to be achieved at the grid connection point. The system automatically regulates the reactive power of the storage system to bring the power factor at the connection point as close as possible to this target. The closer the value is to 1, the less reactive power there is, the more efficient the electricity use, and the better the compliance with grid requirements. |
Auxiliary Control
SOC Calibration
Function overview
SOC calibration uses a controlled charging process to let the system re-establish the true battery level, so that the SoC displayed is more accurate. Once calibration is complete, the system's assessment of the battery level is much closer to reality, providing a reliable basis for subsequent charge/discharge control and strategy execution.
What the function does:
- Corrects SoC deviations, avoiding situations where the battery "appears charged but is actually empty" or "shows empty but still has energy";
- Executes charge/discharge, backup, export limitation and other strategies based on the true battery level, reducing spurious protection trips and strategy anomalies;
- Helps customers judge accurately how much energy is still available, improving the overall stability and predictability of the energy storage system.
This function helps customers with the following:
- More accurate SoC display and more reliable control strategies;
- More realistic assessment of available energy, with fewer spurious protection trips or strategy anomalies.
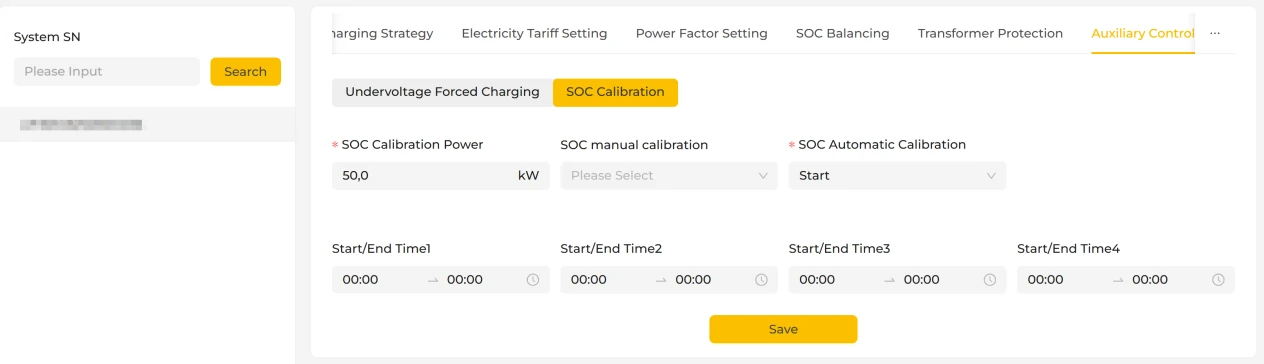
Field descriptions:
| Field name | Value range | Data precision | Description |
|---|---|---|---|
| SOC calibration power (kW) | Value range: 0-6553.5 | One decimal place | The system carries out calibration charging at this power |
| Manual SOC calibration | Drop-down options: Off, On | -- | Enabling "Manual calibration" makes the system calibrate the battery level immediately |
| Automatic SOC calibration | -- | -- | Enabling "Automatic calibration" makes the system carry out calibration charging automatically when the conditions are met |
Undervoltage Forced Charging
Function overview
Undervoltage forced charging is a battery self-protection mechanism for cases where the battery has accidentally been discharged too deeply or has been running at a low SoC for a long time. When the battery voltage is too low, the system automatically starts forced charging to bring the battery back into the safe voltage range.
What the function does:
- Automatically force-charges the battery when the level is too low, preventing undervoltage damage and keeping the system safe;
- Brings the battery voltage back into the safe range promptly, reducing the ageing and performance degradation caused by prolonged operation at a low level.
This function helps customers with the following:
- Prevents undervoltage damage to the battery and improves operating safety;
- Reduces the risk of shortened battery life.
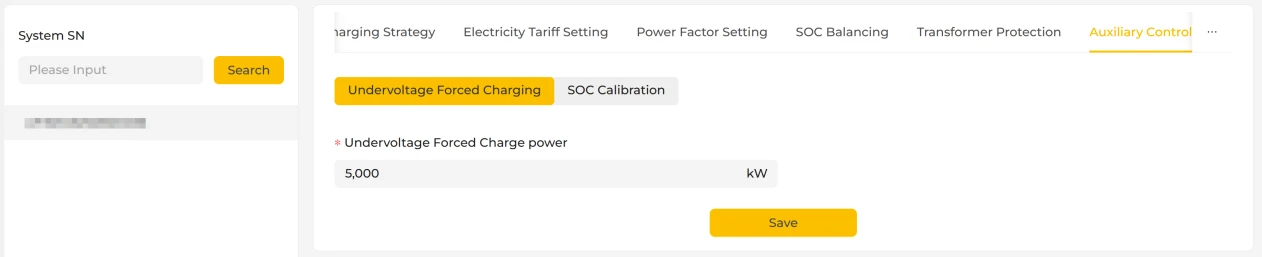
Field descriptions:
| Field name | Value range | Data precision | Description |
|---|---|---|---|
| Undervoltage forced charging power (kW) | -- | Three decimal places | The system carries out forced charging automatically at the configured power |
Dynamic Tariff Scheduling
Function overview
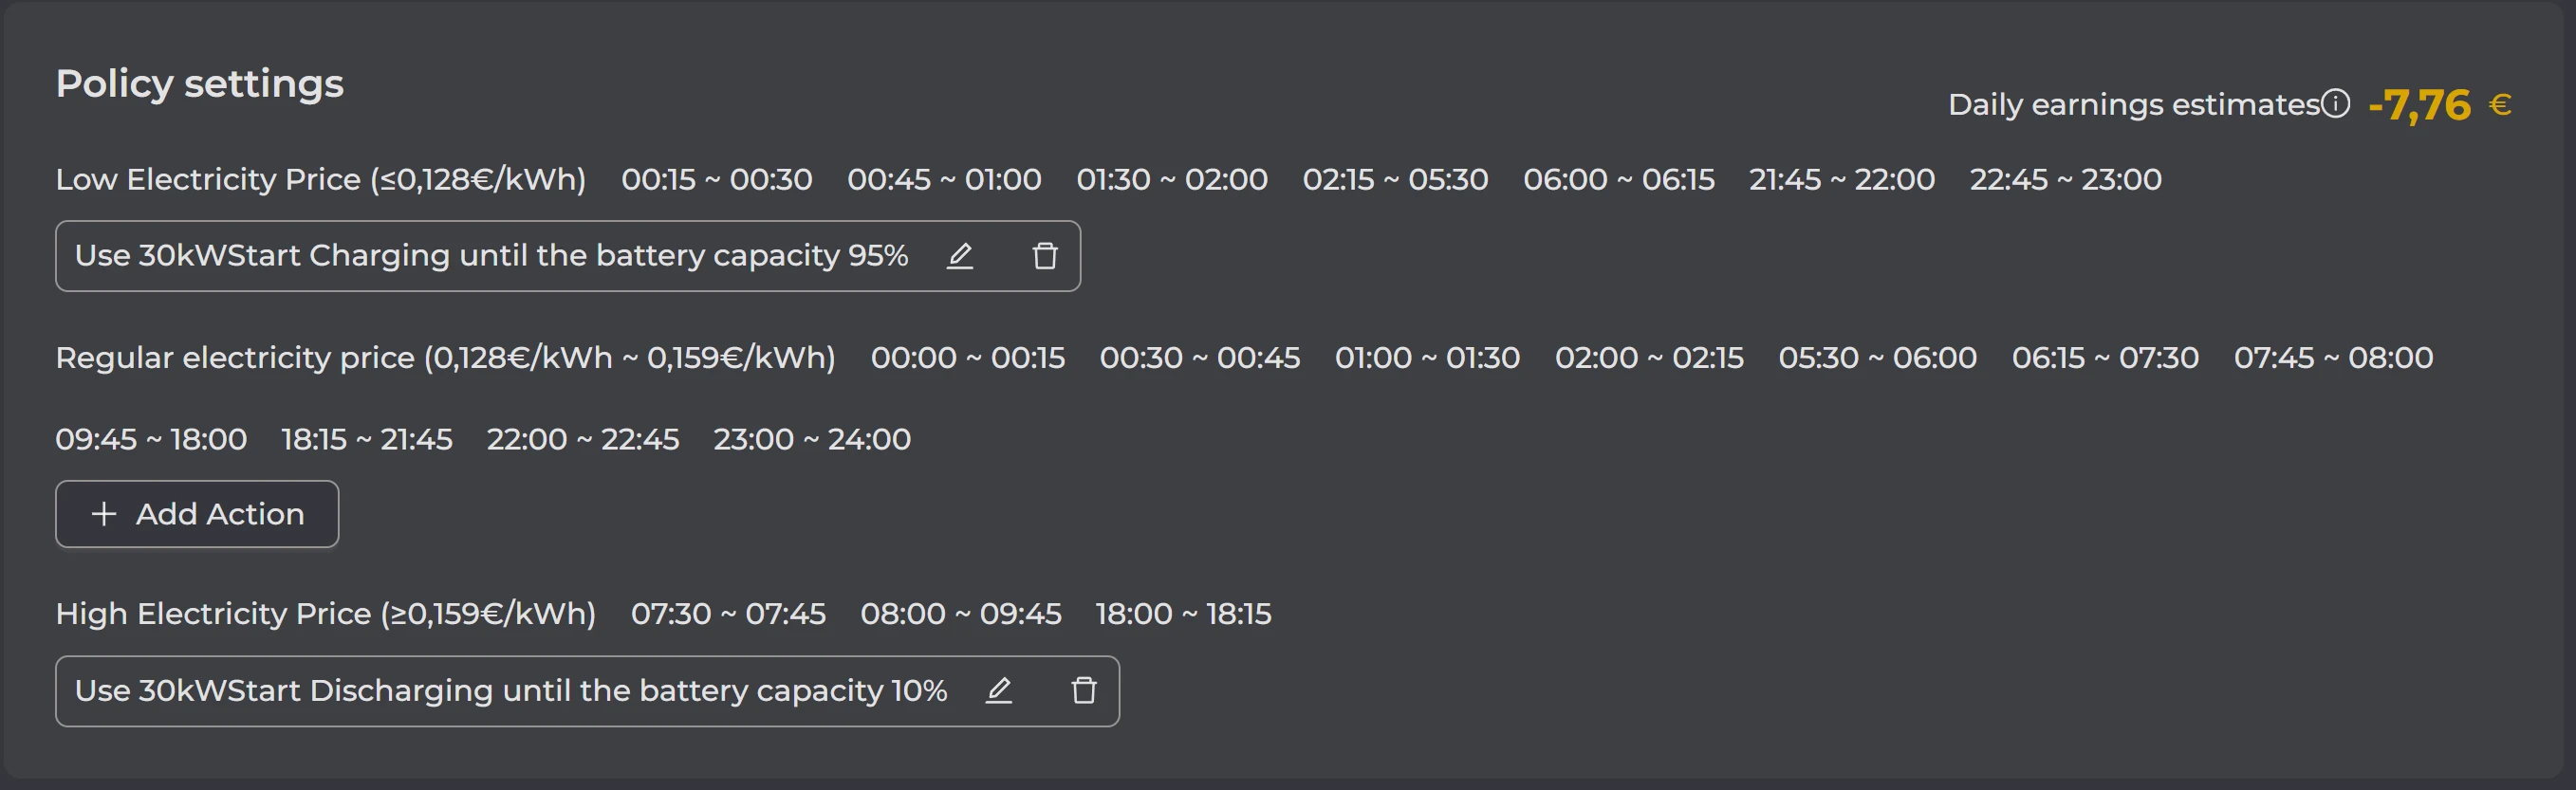
The dynamic tariff scheduling function automatically retrieves electricity market prices and controls when the storage equipment charges and discharges, matching operation to price levels and helping you use electricity and storage more efficiently.
You do not need to check prices or adjust strategies manually each day; the system schedules automatically as prices change.
What the function does:
- Dynamic tariff scheduling automatically adjusts the execution periods according to each day's actual prices;
- By setting a factor and additional charges, you can make the prices calculated by the system closer to the real cost of electricity;
- It improves storage utilisation and optimises electricity costs.
This function helps customers with the following:
- By setting high and low price thresholds in advance, the system charges and discharges automatically to plan, avoiding manual judgement and operating errors;
- It reduces repetitive work.
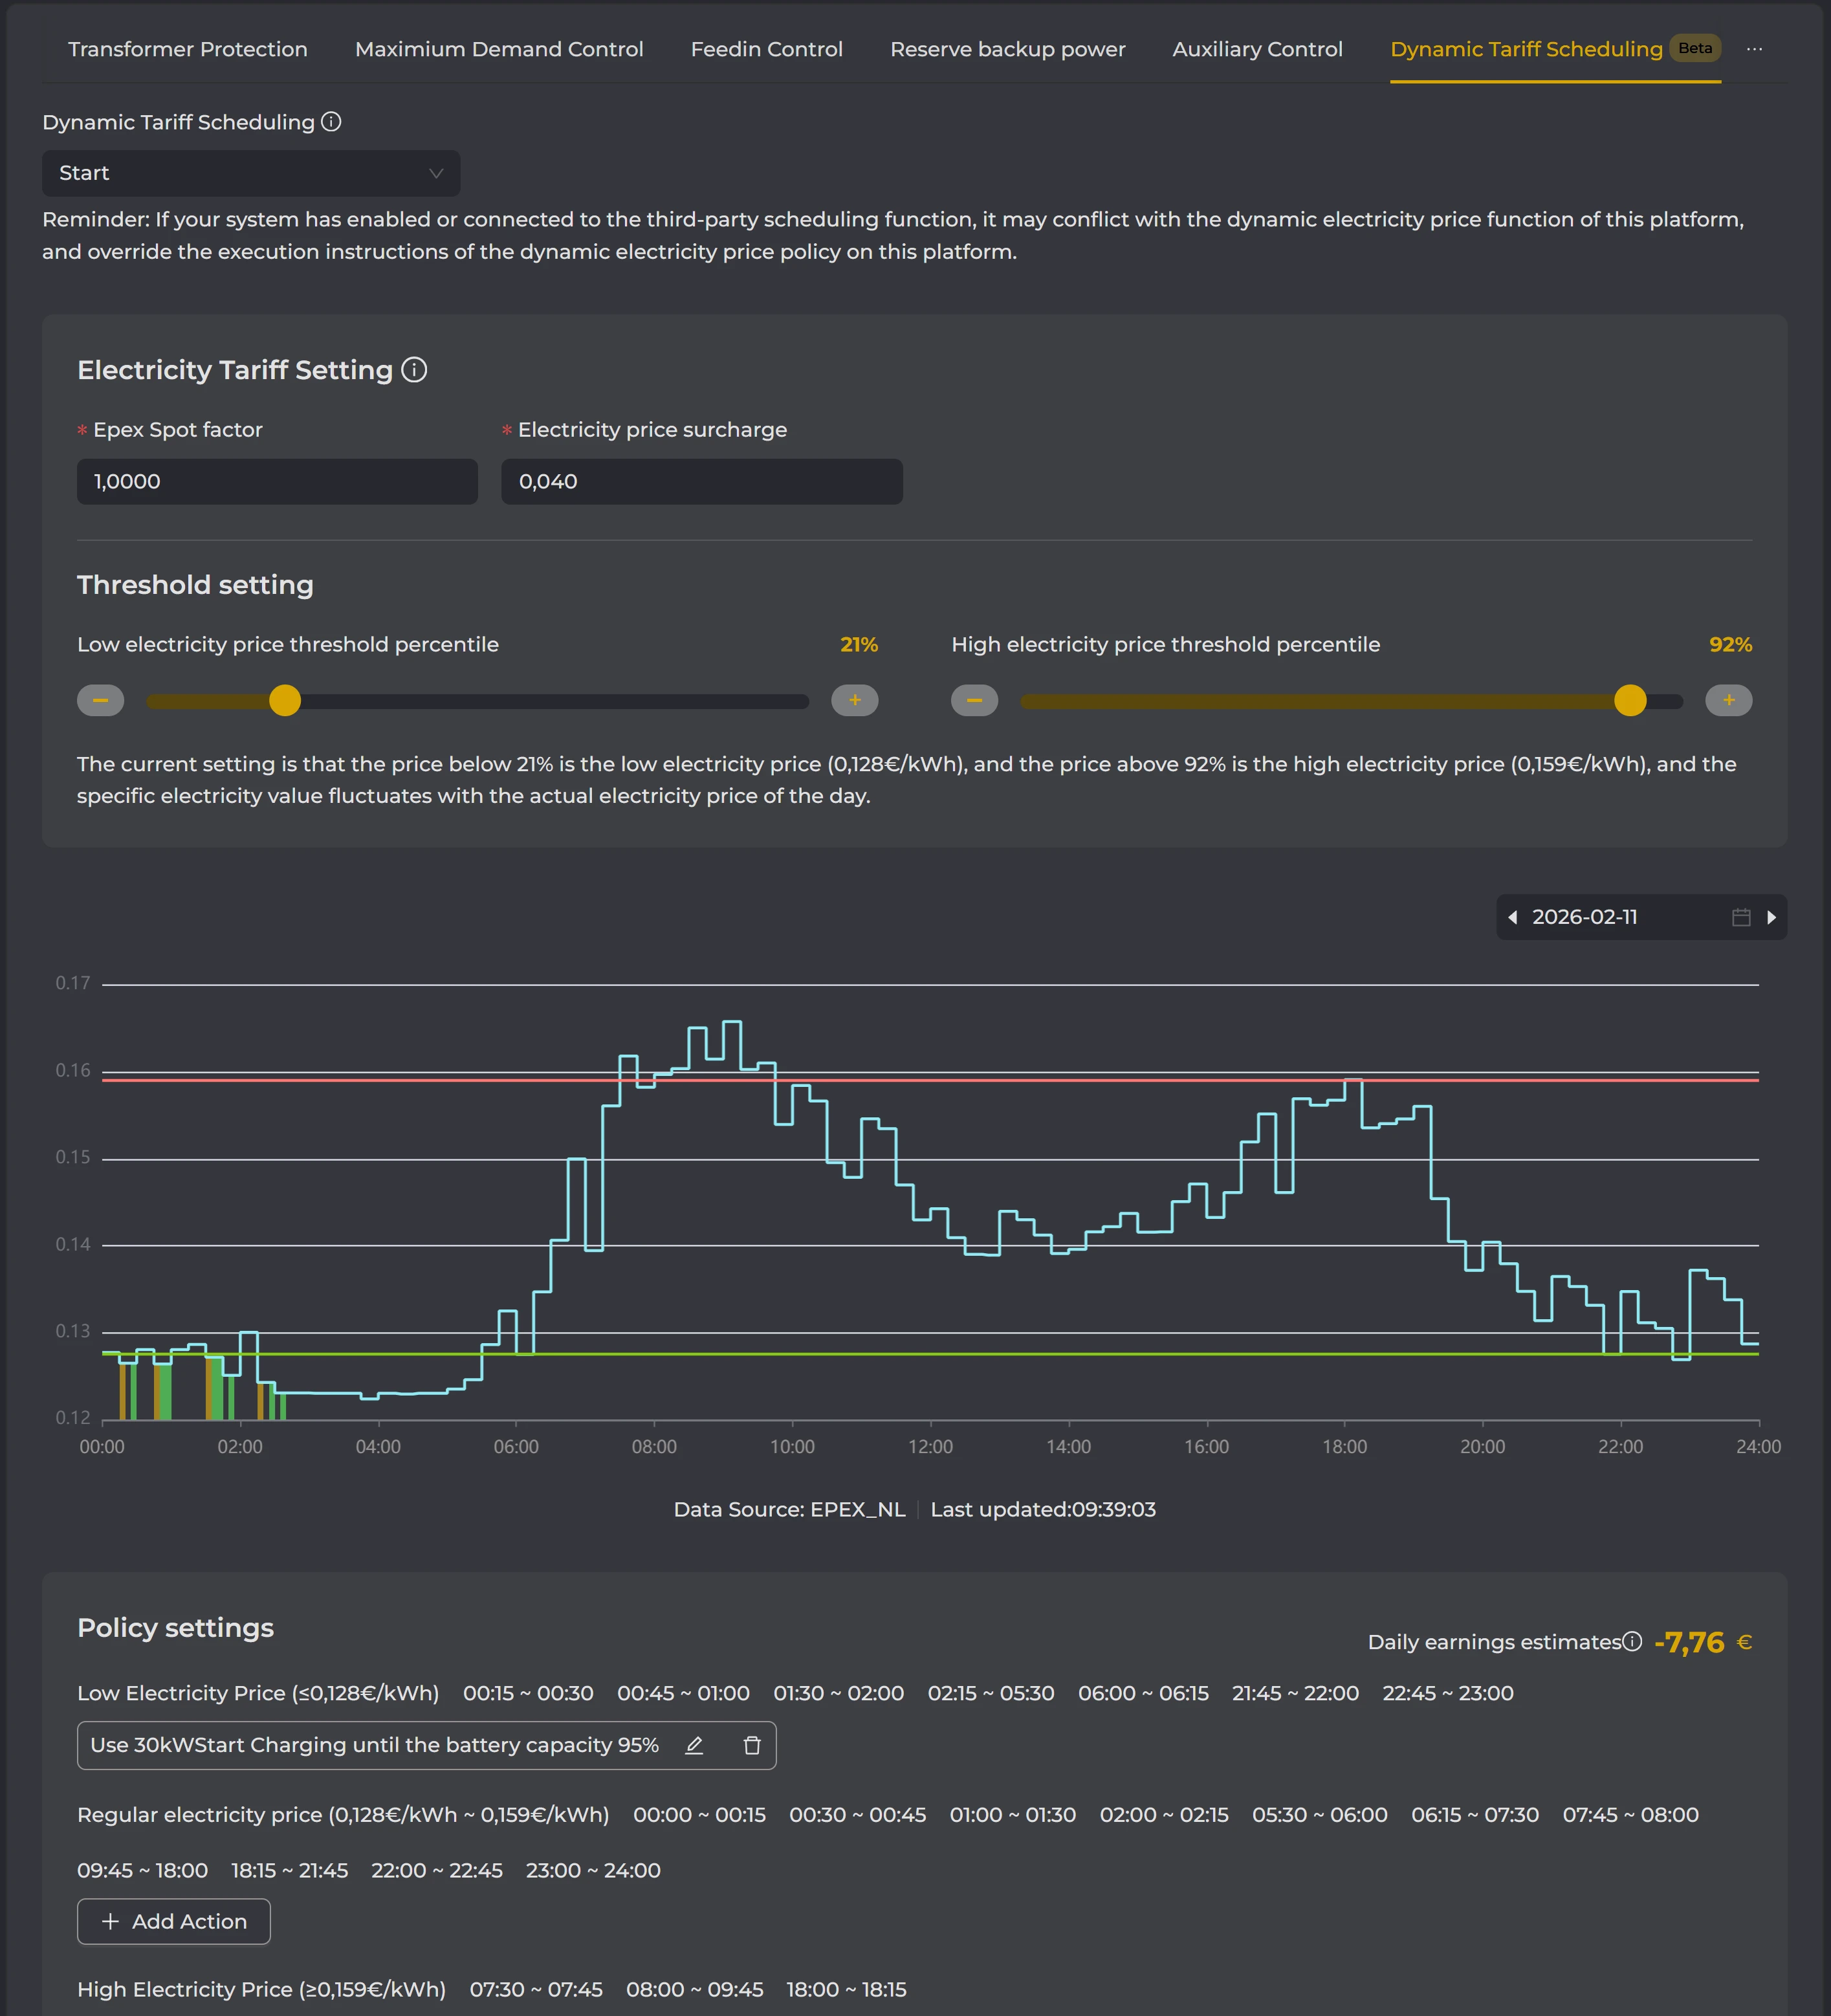
Detailed description
Price data and calculation rules
Mandatory entries:
- Epex spot factor (default 1, four decimal places)
- Additional price component (default 0, three decimal places)
The price shown on the chart = Epex price × Epex spot factor + additional price component (the page shows the calculated "total price").
Where:
EPEX price: the market price from the power exchange
Factor: used to match the actual settlement ratio
Additional component: can be used to add fixed charges (such as service fees or additional costs)
You can set the "factor" and "additional component" yourself according to your actual electricity cost structure, so that the prices calculated by the system are closer to the real settlement price. When viewing historical dates: the historical prices for a given day are calculated and saved using the factor and additional component last set on that day.
Threshold settings (how high and low prices are defined)
The system automatically classifies each day's prices using percentile thresholds, which are then used to determine the charge/discharge strategy for each period.
The classification rules are as follows:
When the price in a period is below the low price threshold percentile, that period is classified as a low price period;
When the price in a period is above the high price threshold percentile, that period is classified as a high price period;
All remaining periods between the two are classified as normal price periods.
Here, "percentile" indicates the relative position of that period's price within the day's price series, not a fixed price value. By adjusting the low and high price percentile thresholds, the system can dynamically define the high and low price ranges according to each day's overall price distribution.
The low price threshold defaults to 30% and the high price threshold to 70%, both with a step of 1%.
You can adjust the percentiles using the plus/minus buttons or by dragging the slider. While dragging, a small bubble above the slider shows the current percentile and the corresponding total price. Threshold lines: once set, a green line (low price line) and a red line (high price line) appear on the chart to mark the corresponding ranges.
Price chart
Mouse-over tooltips:
- If the equipment was charging or discharging at that point in time: the time, charge/discharge type, power (5-minute granularity) and price are shown.
- If there was no charging or discharging at that point: only the time and price are shown.
Charging is shown in green on the chart and discharging in yellow.
You can select a historical date to view past prices; the next day's prices become available at around 12:00 midday Dutch time.
Strategy settings
Estimated daily profit = discharged energy × discharge price − charged energy × charge price. This result is only a reference for setting the high and low price threshold ranges.
Strategy operation logic (how the equipment charges and discharges under high / normal / low prices) The system divides the day into three price ranges: high price / normal price / low price. A charge and discharge strategy can be set separately for each range (for example, discharging allowed/prohibited, charging allowed/prohibited, power limits and so on).
Handling of PV (solar) during charging:
- You can choose to "disconnect PV" or "not disconnect PV":
- Selecting "Yes" (disconnect PV): solar is not involved during the charging phase, and the storage system draws energy only from the grid (or other sources).
- Selecting "No" (do not disconnect PV): solar continues to supply as usual during the charging phase; solar supplies the load first, with any surplus going to the storage system. If solar is insufficient, the storage system tops up from the grid.
- Note: this setting only affects whether solar is allowed to take part during the "charging phase"; it does not change the normal operation of solar outside the charging periods.
During discharging:
- Storage energy supplies the load first; any surplus is fed back into the grid (if the system settings permit feed-in).
Within the "effective execution time range of dynamic tariffs":
- Once discharging is complete, the equipment enters a "discharging prohibited" state (it does not discharge again within that rule period), and PV feeds into the grid at the maximum possible power (selling as much solar back to the grid as possible).
- Once charging is complete, the equipment enters a "charging prohibited" state, and PV still feeds into the grid at maximum power.
Outside the dynamic tariff time range: the equipment continues to follow whichever charge/discharge logic was previously in effect and whose conditions are met (for example, the time-based strategy).
Time-Based Strategy
Function overview
A time-based strategy is a charge and discharge plan configured in advance. It suits sites with clearly differentiated time-of-use tariffs and predictable consumption patterns, or where storage charging and discharging needs to be planned ahead, and it specifies how the energy storage system operates during different periods. With a time-based strategy, the system automatically charges or discharges at the configured times, with no need for real-time manual intervention.
Once the time-based strategy takes effect, the system automatically applies the corresponding mode at the configured times. The operating modes inside and outside the configured periods can be set separately, and other site protection and control strategies are not affected.
What the function does:
- Plans in advance how the storage system charges and discharges during different periods;
- Switches operating modes automatically according to the time;
- Improves storage utilisation and optimises electricity costs.
This function helps customers with the following:
- By setting the time periods in advance, the system charges and discharges automatically to plan, avoiding manual judgement and operating errors;
- It charges automatically during low-price periods and discharges during high-price periods, helping to reduce electricity costs and improve storage returns;
- The time-based strategy takes effect automatically and runs long term, with no daily manual adjustments needed, reducing maintenance effort and making operation more stable.
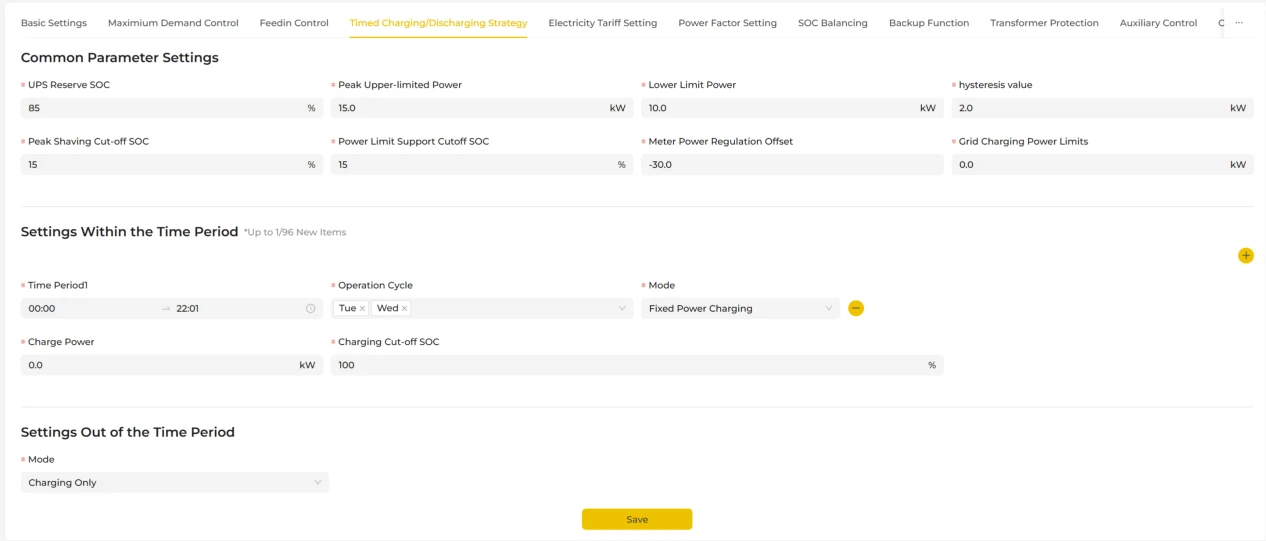
Note: the content shown on the time-based strategy page varies by equipment model and software version. The field descriptions here cover all fields across the different versions of the time-based strategy page.
Field descriptions:
| Field name | Value range | Data precision | Description |
|---|---|---|---|
| Allow discharging when demand protection is triggered | Drop-down options: Allow, Prohibit | -- | Whether the storage battery is allowed to discharge to help carry the load when the power drawn at the grid connection point triggers demand protection. When enabled, the battery can discharge to help lower the power draw; when disabled, the battery does not discharge even if demand protection is triggered. |
| Allow charging when export limitation protection is triggered | Drop-down options: Allow, Prohibit | -- | Whether the storage battery is allowed to charge when the system triggers export limitation protection (PV greater than load) in Self-Consumption mode. When enabled, the battery can absorb the surplus energy by charging, avoiding export to the grid; when disabled, the battery no longer charges when export limitation protection is triggered. |
| Self-Consumption reserved SOC (%) | Value range: 5-100 | Integer | Sets the minimum SoC reserved in Self-Consumption mode. When the storage SoC falls below this value, the system preserves the remaining energy and stops discharging. |
| Peak shaving limit (kW) | Value range: 0~99999.9 | One decimal place | When the power drawn from the grid exceeds the peak shaving limit, the storage system discharges to reduce the grid draw. Effective only in peak shaving and valley filling mode. |
| Valley filling threshold (kW) | Value range: 0~99999.9 | One decimal place | When the power drawn from the grid falls below the valley filling threshold, the storage system charges to increase the grid draw. Effective only in peak shaving and valley filling mode. |
| Regulation hysteresis (kW) | Value range: 0~99999.9 | One decimal place | Acts as a buffer around the peak shaving limit and valley filling threshold power ranges; default value: 0. Effective only in peak shaving and valley filling mode. |
| Peak shaving discharge cutoff SOC | Value range: 5-100 | Integer | Sets the lowest SoC to which discharging is allowed during peak shaving. Effective only in peak shaving and valley filling mode. |
| Power limitation support cutoff SOC | Value range: 5-100 | Integer | Sets the minimum SoC limit for the storage system to provide power support in power limitation or power-controlled scenarios. Effective only in power limitation support mode. |
| Meter power regulation deviation | Value range: -99999.9~99999.9 | One decimal place | Used to set meter power control. Effective only in power limitation support mode. |
| Grid charging power limit (kW) | Value range: 0-99999.9 | One decimal place | Limits the maximum power at which the grid charges the battery. Effective only in fixed power charging mode. |
| Charging power (kW) | Value range: 0~99999.9 | One decimal place | The power at which the equipment charges the battery. |
| Charge cutoff SOC (%) | Value range: 5-100 | Integer | Charging stops automatically when the battery reaches this SoC. |
| Discharging power (kW) | Value range: 0~99999.9 | One decimal place | The power at which the equipment discharges the battery. |
| Discharge cutoff SOC (%) | Value range: 5-100 | Integer | Charging stops automatically when the battery discharges to this SoC. |
Off-Grid Operation
PV-Storage-Diesel Coordination
Function overview
In off-grid situations, PV, battery and diesel generator supply power together automatically. The generator is started and stopped automatically according to the battery level or the time, and the battery is charged appropriately, keeping off-grid supply stable and fuel consumption low.
What the function does:
- Without a grid connection, PV, battery and diesel generator work together automatically to keep supply continuous and stable;
- The system starts and stops the generator automatically according to the battery level or the time, avoiding unnecessary running and reducing fuel and maintenance costs;
- It makes full use of PV generation and battery storage, reducing reliance on the diesel generator and making off-grid supply greener and more economical.
This function helps customers with the following:
- Continuous, stable supply in off-grid situations;
- Less unnecessary generator running and lower fuel consumption;
- PV and battery used as a priority for better economics.
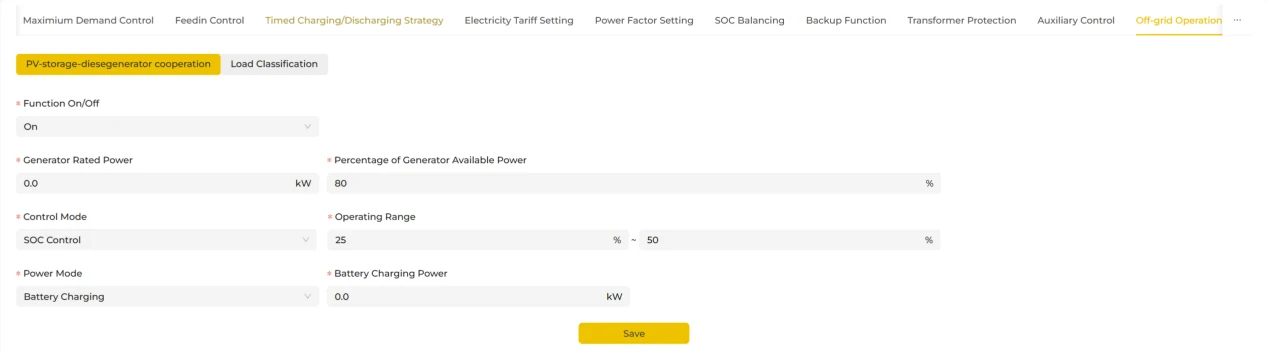
Field descriptions:
| Field name | Value range | Data precision | Description |
|---|---|---|---|
| Diesel generator rated power (kW) | Value range: 0-6553.5 | One decimal place | Sets the maximum output power of the diesel generator |
| Diesel generator available power percentage (%) | Available generator output = diesel generator rated power * diesel generator available power percentage | ||
| Control mode | Drop-down options: SOC mode, Time period mode, Manual mode | SOC mode: the generator starts when the battery level falls below the start SOC and stops when the battery level rises above the stop SOC. | |
| Operating range | The generator starts when the storage SoC falls below the minimum of this range and is cut off when it rises above the maximum | ||
| Power mode | Drop-down options: Battery charging, Diesel generation | Selects how the energy storage system operates off-grid or in PV-storage-diesel coordination: | |
| Battery charging power (kW) | Sets the power at which the storage battery charges |
Load Prioritisation
Function overview
The load prioritisation function safeguards important loads based on the battery level (SoC). When the level is low, general loads are disconnected first and important loads only afterwards; once the level recovers, supply is restored in the same order. Important loads are the last to be cut off and the first to be restored.
Value relationship: general load restoration SOC > (important load restoration SOC / general load cutoff SOC) > important load cutoff SOC.
What the function does:
- By allocating energy by priority, it extends supply to critical loads when energy is scarce, improving the overall endurance of the system;
- It switches loads out in stages automatically, avoiding the production or equipment risks of an all-at-once outage, with no manual operation required at any point.
This function helps customers with the following:
- Critical loads stay powered;
- Longer endurance when energy is low;
- Avoids sudden site-wide outages;
- Fully automatic control with no manual load switching required.

Field descriptions:
| Field name | Value range | Data precision | Description |
|---|---|---|---|
| General load cutoff SOC (%) | Value range: 5-100 | Integer | When the current battery level reaches the SoC value set here, the general loads connected to the storage system are disconnected. |
| General load restoration SOC (%) | Value range: 5-100 | Integer | When the current battery level reaches the SoC value set here, the general loads connected to the storage system are restored. |
| Important load cutoff SOC (%) | Value range: 5-100 | Integer | When the current battery level reaches the SoC value set here, the important loads connected to the storage system are disconnected. |
| Important load restoration SOC (%) | Value range: 5-100 | Integer | When the current battery level reaches the SoC value set here, the important loads connected to the storage system are restored. |
Log List
The system provides several types of log to record equipment operating status, system operations and the upgrade process, making troubleshooting and operational analysis easier.
Upgrade logs mainly record the full process of OTA equipment upgrades, including the upgrade version, upgrade time and upgrade result.
Operation logs record all commands issued to the equipment, including the parameter changes made, the time the command was issued and the execution result, allowing user and system actions to be traced.
System logs record the interaction status between equipment and system, such as whether the equipment is online and system list requests, helping you assess the connection and communication between the equipment and the platform.
Operating logs are divided into real-time data and local data: real-time data mainly records operating logs and supports resumed transmission after a network outage, ensuring the log data is complete and reliable. Local data records and uploads data generated by the equipment during local operation, for analysing long-term equipment behaviour.

Basic Settings
Plant System Management
Install a Plant
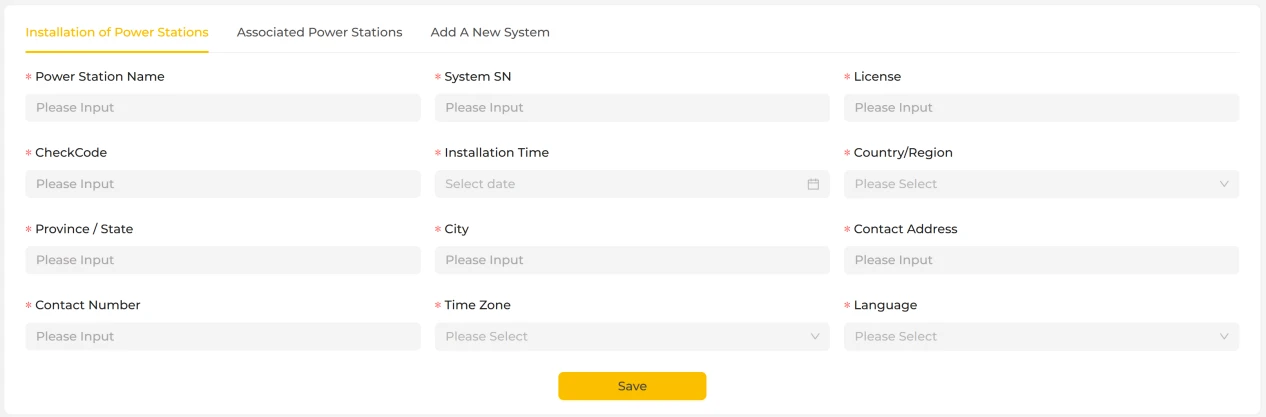
The Install Plant page is used to create a new plant and bind system equipment to it.
On this page, enter the plant's basic information; fields marked with "*" are mandatory, so please make sure the information you provide is complete and accurate. Once all mandatory fields are complete, click the "Save" button at the bottom of the page to finish installing the plant. After a successful save, the plant is created and appears in the plant list, ready for subsequent device monitoring, strategy configuration and data viewing.
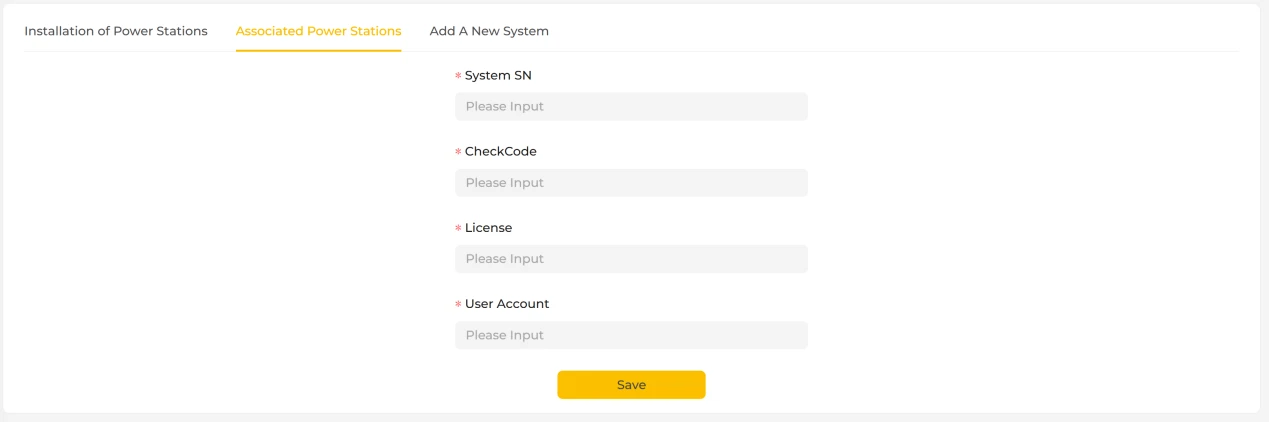
Link a Plant
The Link Plant page is used to link existing system equipment to a user account without creating a new plant, for cases where the equipment already exists but has not yet been bound to a user account.
On this page, enter the key system information used to link the system to the plant. Fields marked with "*" are mandatory, so please make sure the information you enter is accurate.
Once all mandatory fields are complete, click the "Save" button at the bottom of the page. After the system verifies the details, the equipment is successfully linked to the account, and you can then view the plant's operating status, equipment information and related data on the platform.
The Link Plant function is mainly used for binding existing equipment to an account or adding permissions; it does not affect the plant's existing operating data or configuration parameters.
Add a System
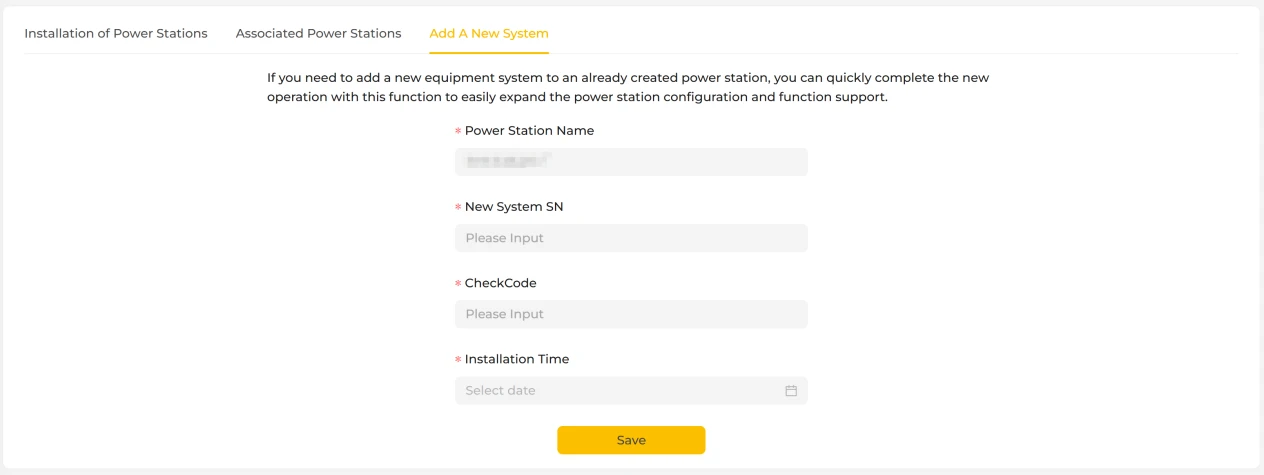
When you need to add a new equipment system to an existing plant, the Add System function lets you configure it quickly, helping the plant expand its equipment and gain access to more functions.
On this page, the system displays the currently selected plant name by default; you only need to enter the details of the new system to complete the operation. Fields marked with "*" are mandatory, so please make sure the information is accurate. Once all mandatory fields are complete, click the "Save" button at the bottom of the page. After the system verifies the details, the new equipment system is added to the plant and can be monitored and managed centrally on the platform. Adding a system does not affect the operating status or historical data of equipment already in the plant.
User Settings
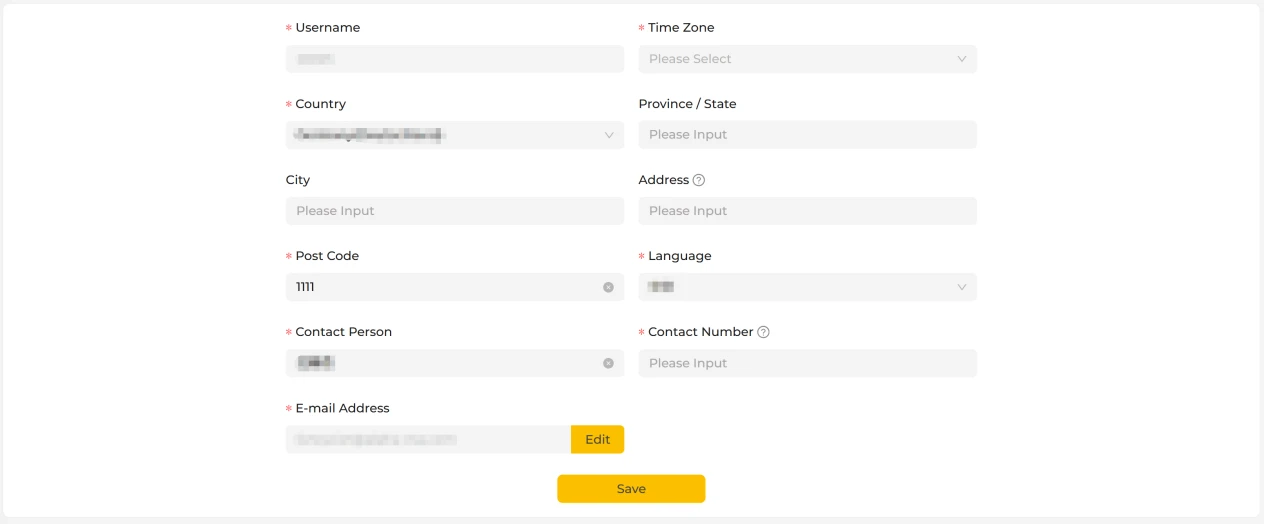
User Information Settings
This page is used to manage and maintain your basic user information. You can view and change your personal details here to keep your account information accurate and complete. Once you have made your changes, please save the settings promptly; the system will then apply the latest information.
Change Password
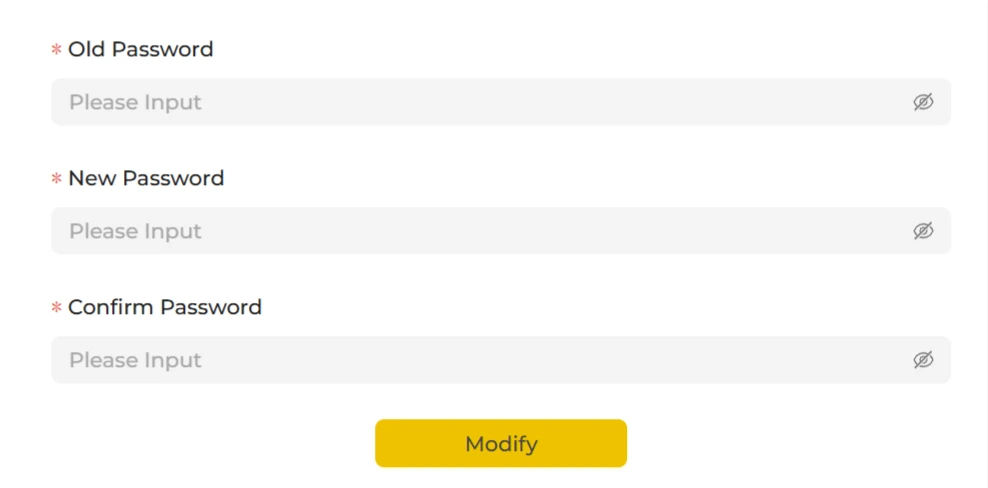
This page is used to change the login password of the current account. To keep your account secure, enter your existing password as prompted and set a new login password.
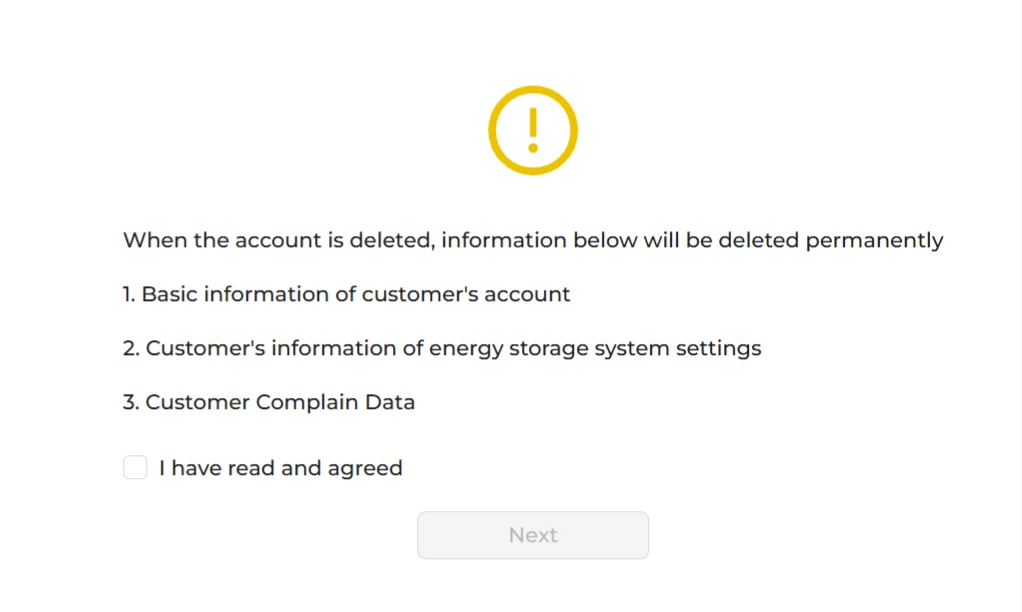
Delete Account
Once you tick to agree, your personal data will be erased from the system. The steps are: tick to agree, click Next to obtain a verification code — the code is sent to your email address — then enter the code and click Confirm to complete the account deletion.
Resource Centre
When you click Resource Centre, the system automatically redirects you to the online service centre website. There you can browse and download installation manuals, user instructions and related technical documentation for the various equipment models.
The Resource Centre is maintained continuously by a specialist team and covers a comprehensive range of content, providing reliable reference and support for equipment installation, commissioning and everyday use.
If you encounter a problem, we recommend consulting the relevant documentation for your equipment first, so that you can identify and resolve it quickly.
Customer Feedback
If you encounter any problem while using the equipment, you can report it to us by submitting a complaint. We will handle and follow up all complaints centrally, helping you identify the problem promptly and providing an appropriate solution.
To speed up processing, we recommend providing complete equipment details and a full description of the problem when you submit.