Overview, Monitoring and Alarms
Home
Summary
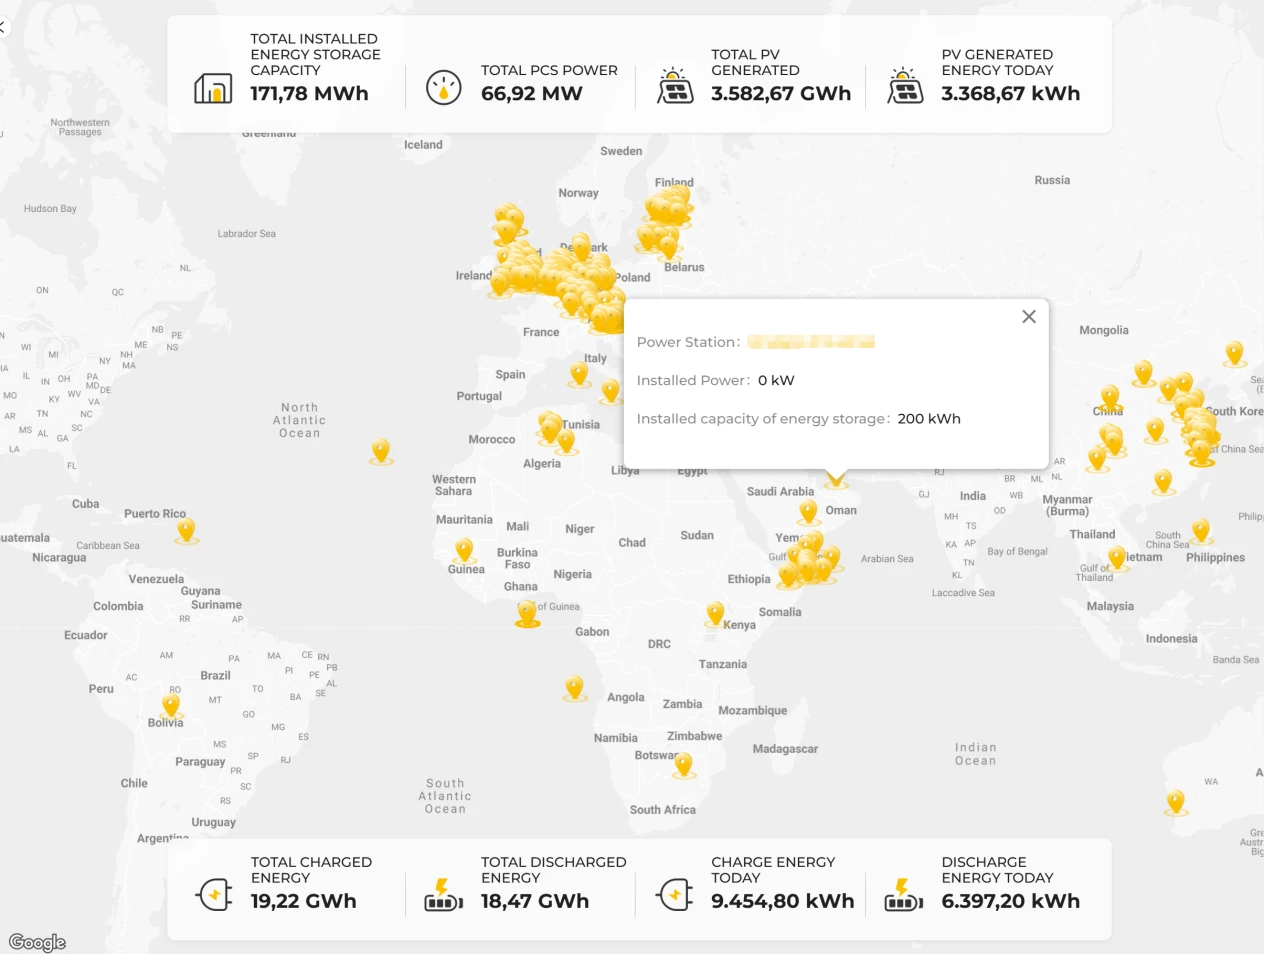
The Summary page on the Home screen shows the overall operating status of every plant bound to your account, with the relevant data collected and aggregated automatically by the system.
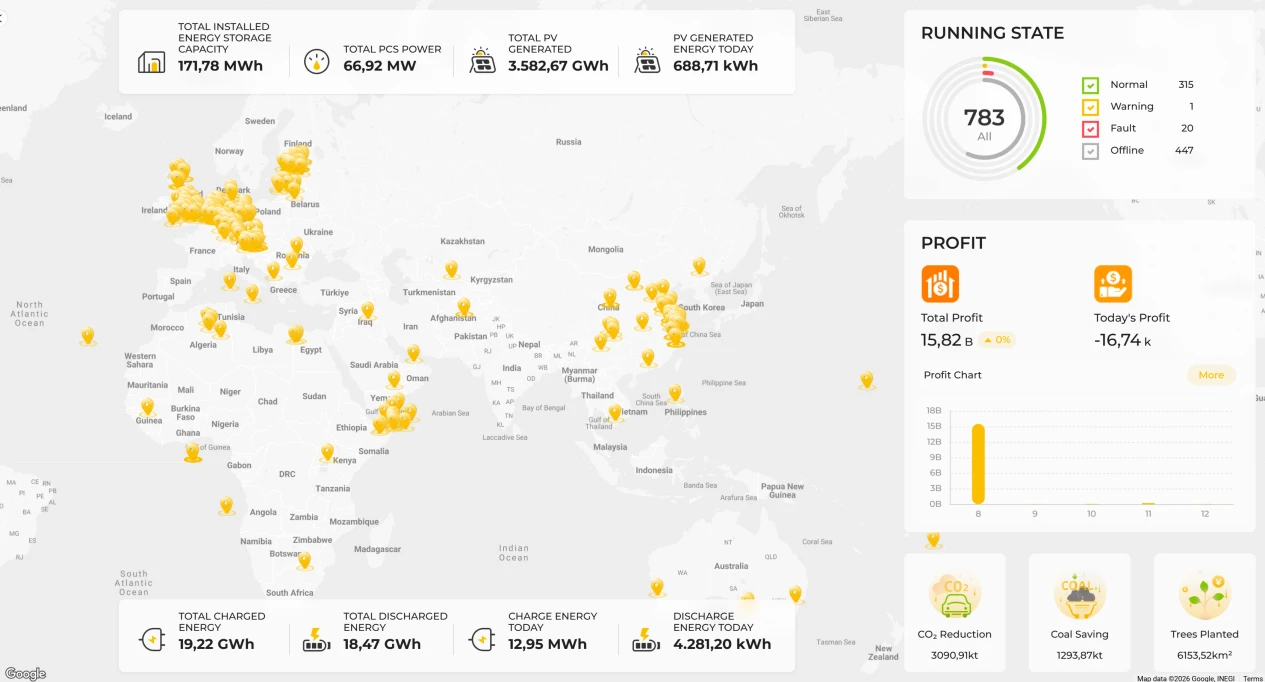
The individual indicators are explained below:
Total installed storage capacity: the sum of the total battery capacity entered under "Plant Basic Information" for all plants.
Total PCS power: the sum of the installed PCS power entered under "Plant Basic Information" for all plants.
Total PV generation: the combined total of the PV generation recorded by the PCS and the cumulative generation of the PV grid-tied inverters across all plants.
PV energy today: the combined total of today's PV generation recorded by the PCS and today's generation of the PV grid-tied inverters across all plants.
Refer to the figure below for the page layout.

Total battery charge / Total battery discharge: the cumulative battery charge and discharge energy recorded by the system since the date the equipment was installed.
Battery charge today / Battery discharge today: the battery charge and discharge energy recorded by the system for the current day.

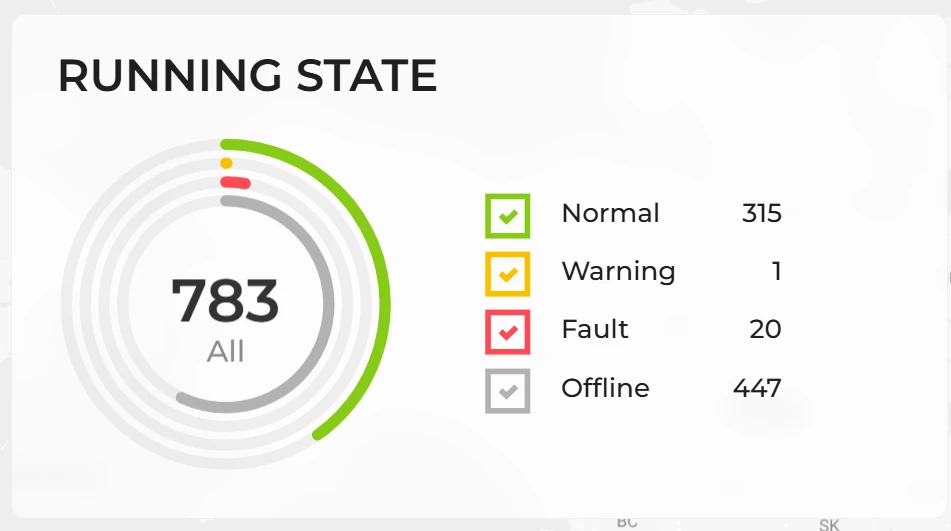
Plant equipment has four operating states in the system, which help you understand the current condition of the equipment at a glance:
Normal: the equipment is operating normally and all functions are working correctly.
Alarm: the equipment has reported an advisory abnormality. Basic operation is not yet affected, but you are advised to check the details promptly.
Fault: the equipment has an abnormality or fault that may affect normal operation. Please contact your service or after-sales personnel as soon as possible.
Offline: the equipment is not currently connected to the platform, so the platform cannot retrieve its data.
Refer to the figure below for the page layout.
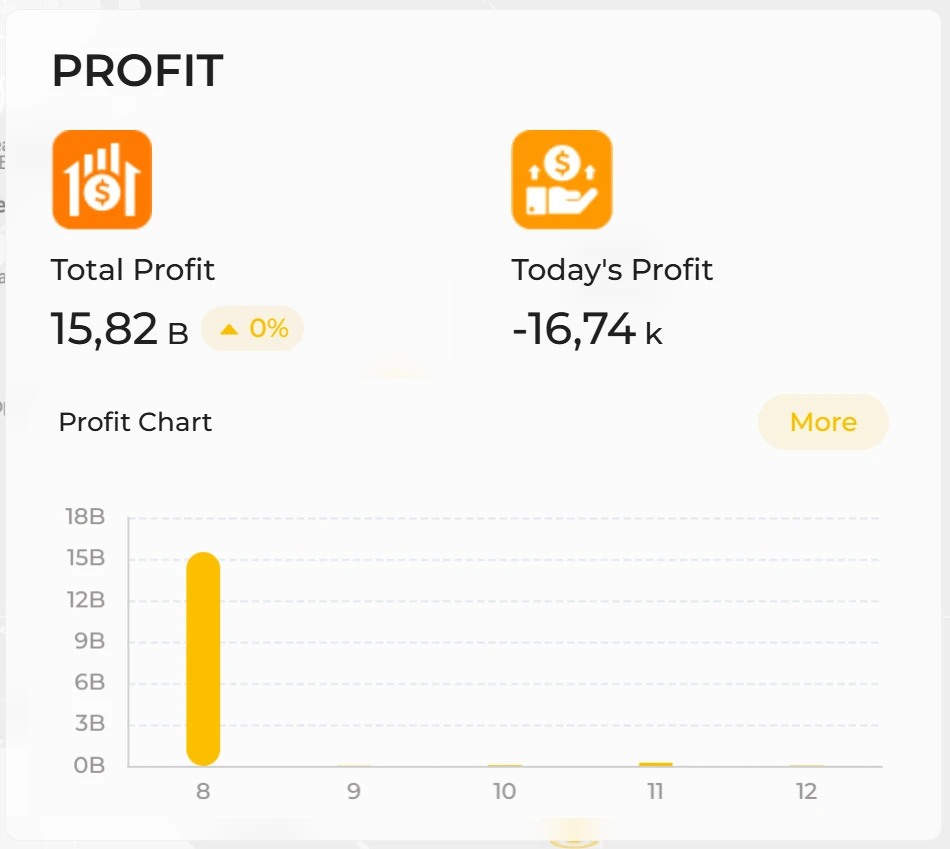
Profit summary shows the overall profit performance of all plants under the current account.
The page displays both cumulative profit and today's profit, giving you a quick overview of how your plants are performing. The profit chart below presents the profit trend over different periods in a clear visual form, making comparison easy.
For more detailed profit data and statistical analysis, click the "More" button in the top right corner of the page to open Statistics and Analysis → Profit Report, where you can view detailed profit information by time period.
Refer to the figure below for the page layout.
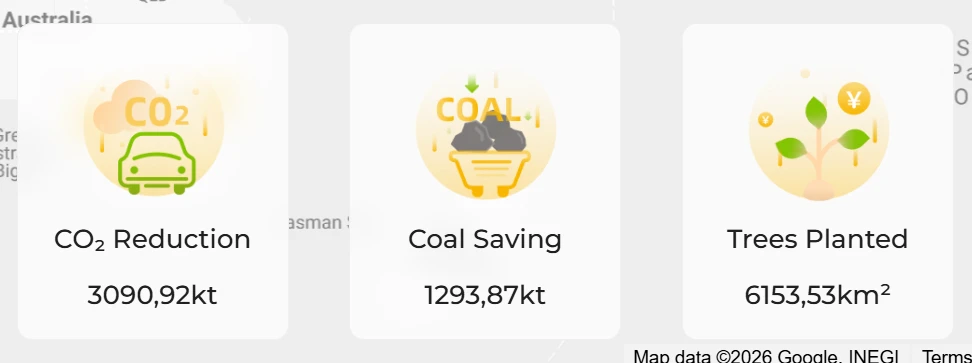
Environmental indicators show the environmental benefits delivered by the system, specifically:
CO2 emissions reduced: the cumulative carbon dioxide emissions avoided since the system was commissioned.
Coal saved: the cumulative amount of coal saved since the system began operating.
Equivalent trees planted: the total number of trees equivalent to the emissions reduction achieved by the system.
Refer to the figure below for the data display.
Map
All bound plants are shown as markers on the map.
Click any marker to open the plant information panel, where you can view detailed information about that plant.
For a fuller overview, click the "Power Station" button in the panel to jump to the plant's overview page and view all of its information.
Plant Overview
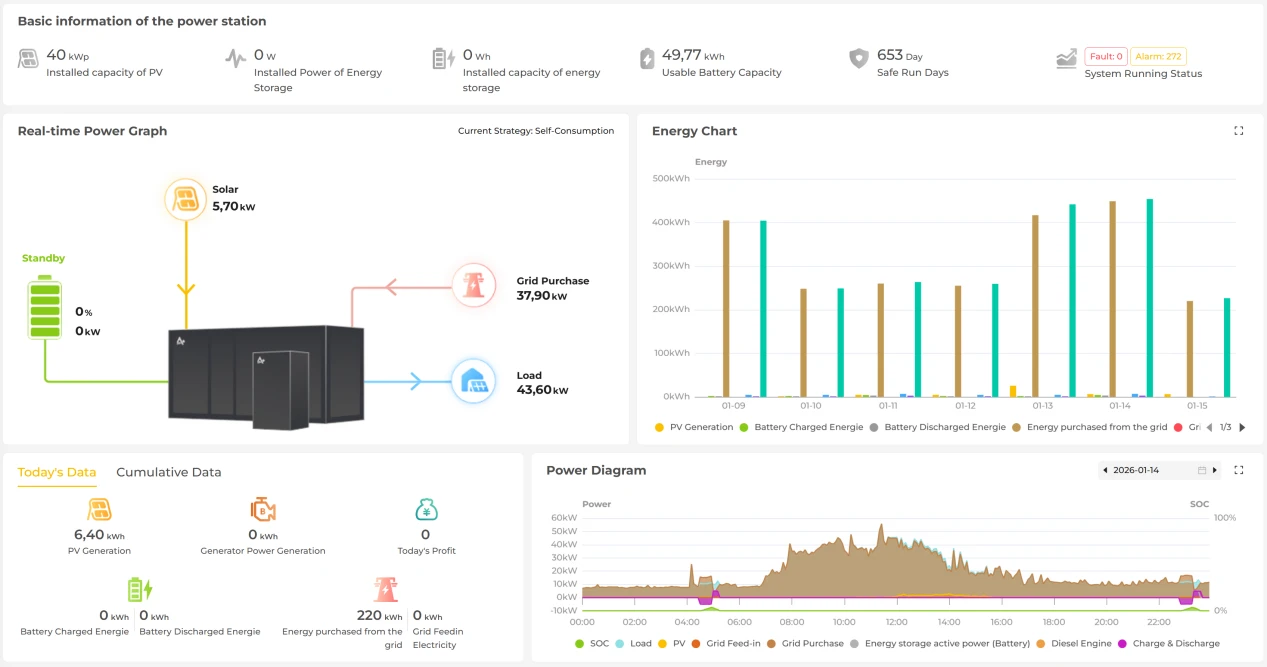
The Plant Overview page provides real-time operating status and detailed statistics for a plant, helping you quickly assess its overall performance and energy efficiency. The page consists of the following main sections:
Plant basic information: the plant's basic configuration data, such as installed PV capacity, installed storage capacity and the system operating status.
Real-time power diagram: the plant's current power output, including PV generation, battery discharge, load power and energy purchased from the grid.
Energy statistics chart: electricity generation and consumption over different periods. The chart clearly shows the energy flows between the battery, the grid, the load and PV generation.
Today's data: PV generation, battery charge, battery discharge, energy purchased from the grid and more, giving a detailed breakdown of the day's energy data.
Cumulative data: cumulative PV generation, battery charge and discharge, grid energy and so on since installation.
Power chart: the plant's operating power over different periods, including PV generation power, load power, storage power and grid energy, helping you understand real-time plant operation.
Device Monitoring
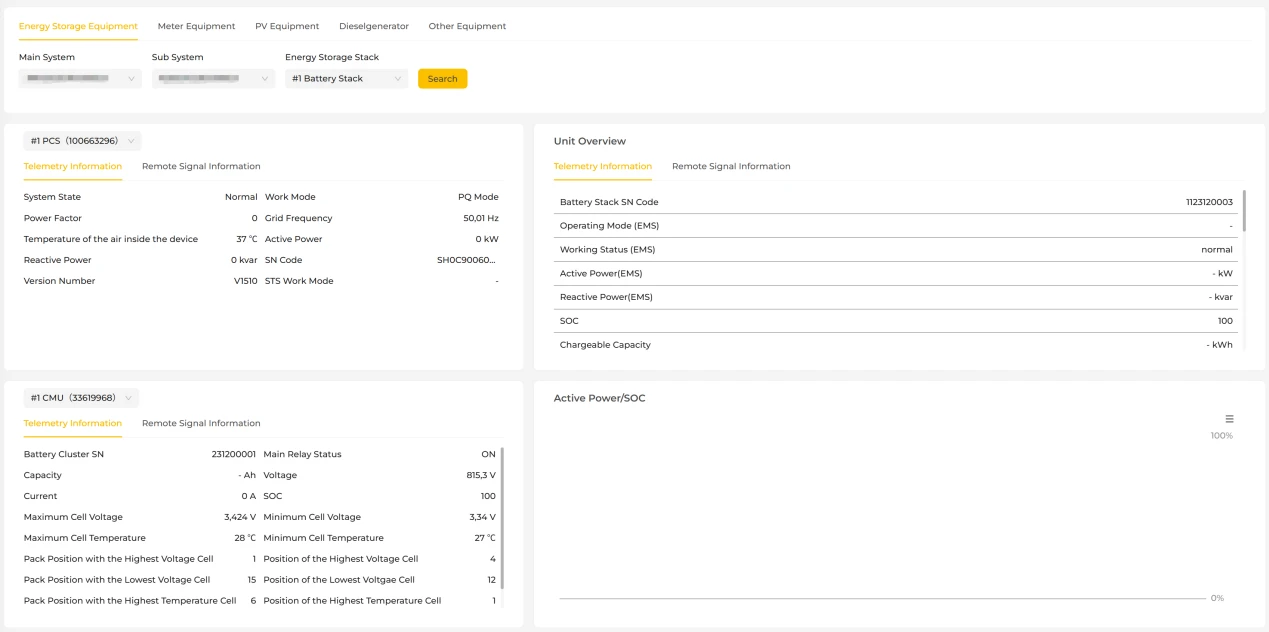
The Device Monitoring page provides detailed information on every device bound to the plant. Here you can view the operating status and data of each device in real time and make sure the plant's equipment is running correctly.
Display rules: the system only shows the device types that are actually connected and present in the customer's plant. If no PV equipment is configured, the "PV Devices" section is not shown; if no diesel generator is configured, the "Diesel Generator" section is not shown.
The page is divided into the following sections: Storage Devices, Meters, PV Devices, Diesel Generator and Other Devices.
Storage devices: this section shows real-time data and status for the storage system equipment in the plant, including inverter telemetry and status signal data, the operating status of each storage module, and charge/discharge data.
Meters: this section shows data from the plant's grid connection meter and metering meters.
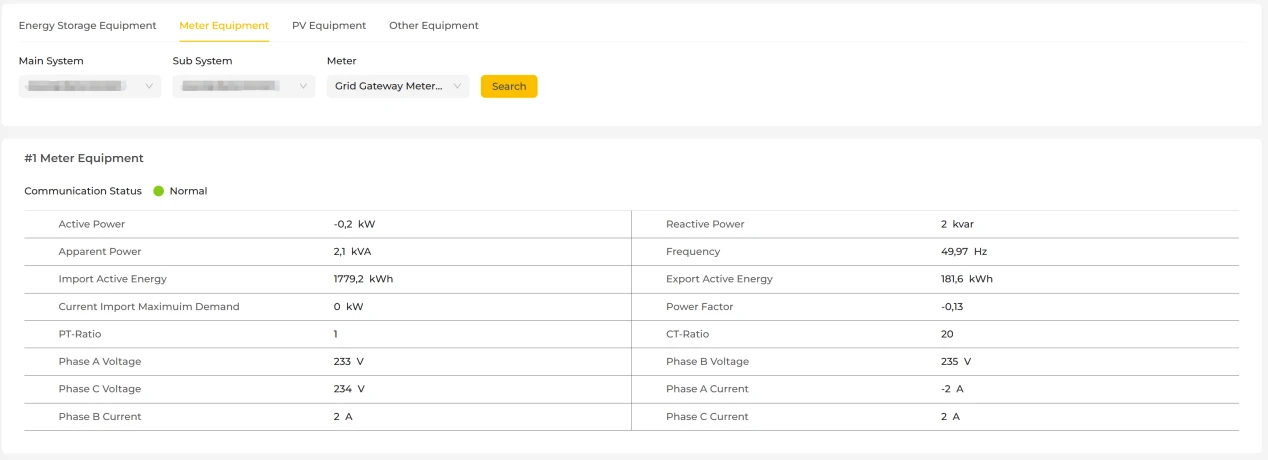
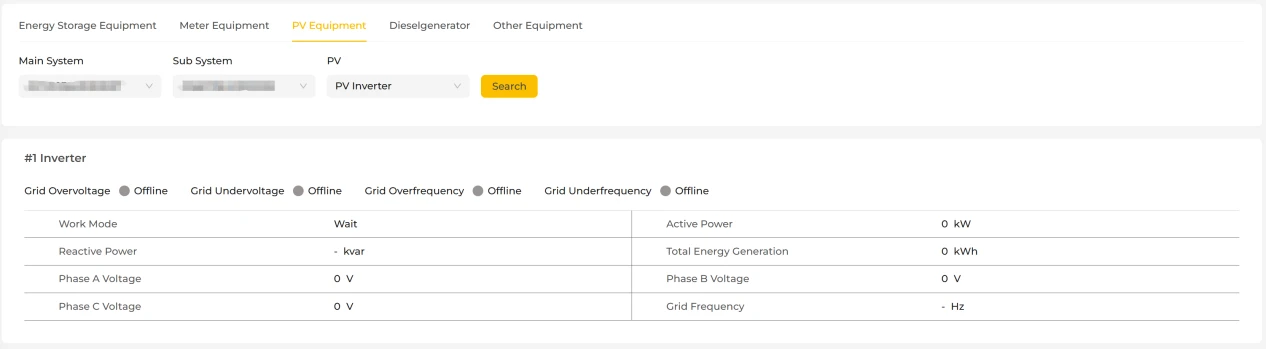
PV devices: this section appears for plants with PV equipment and shows data from the plant's PV inverters.
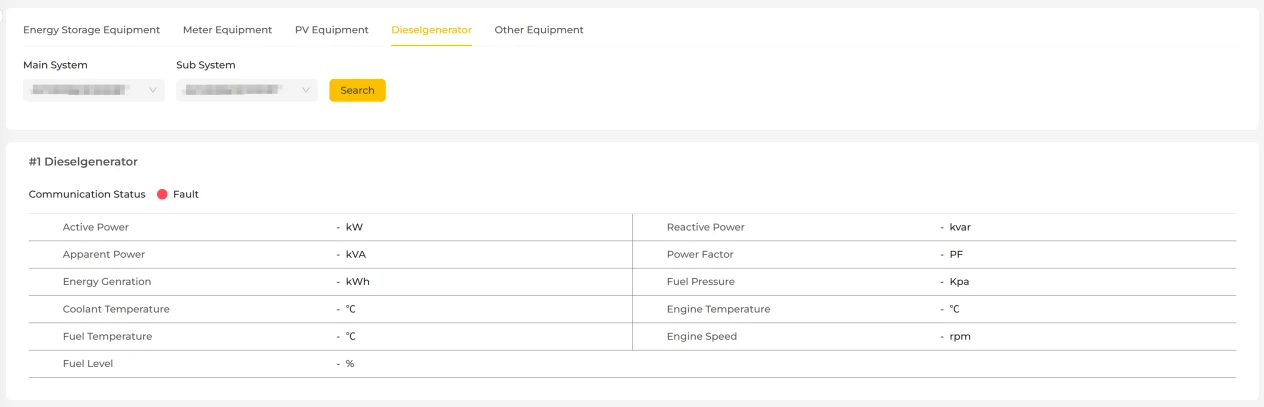
Diesel generator: this section appears for plants with a diesel generator and shows the related generator data.
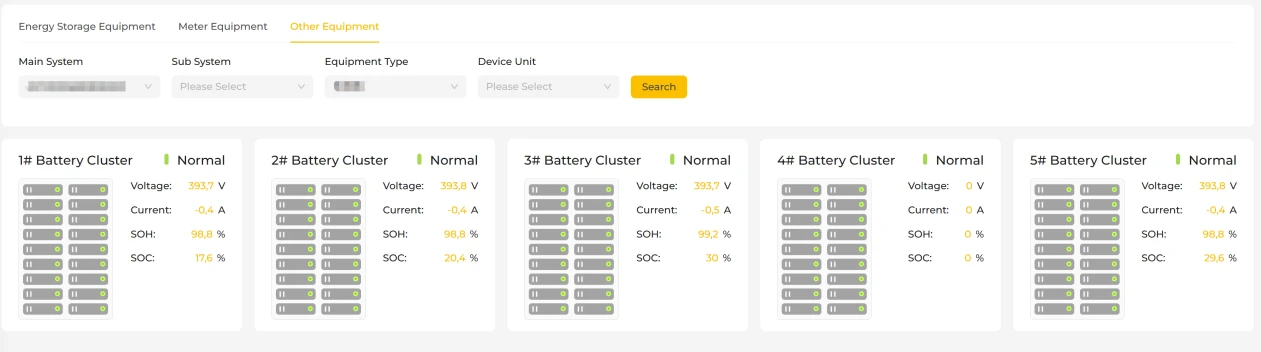
Other devices: shows data for equipment such as battery stacks, dehumidifiers and thermal management units.
Statistics and Analysis
Curves
The Curves page contains two parts: plant power curves and device curves.
Power curves
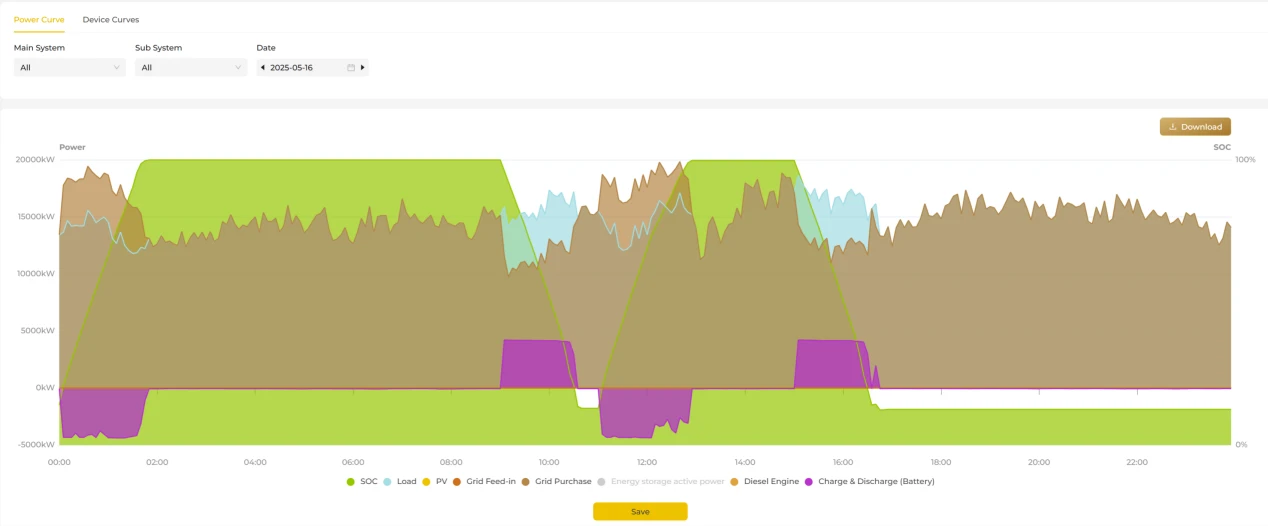
The power curve page shows how the system has operated over the course of a day, giving you a clear picture of the energy changes. Here you can view the key operating data for each sub-system, including SOC, load power and grid feed-in power. All data is sampled and displayed at a 5-minute granularity, providing a detailed view of how the system behaves throughout the day.
Device curves
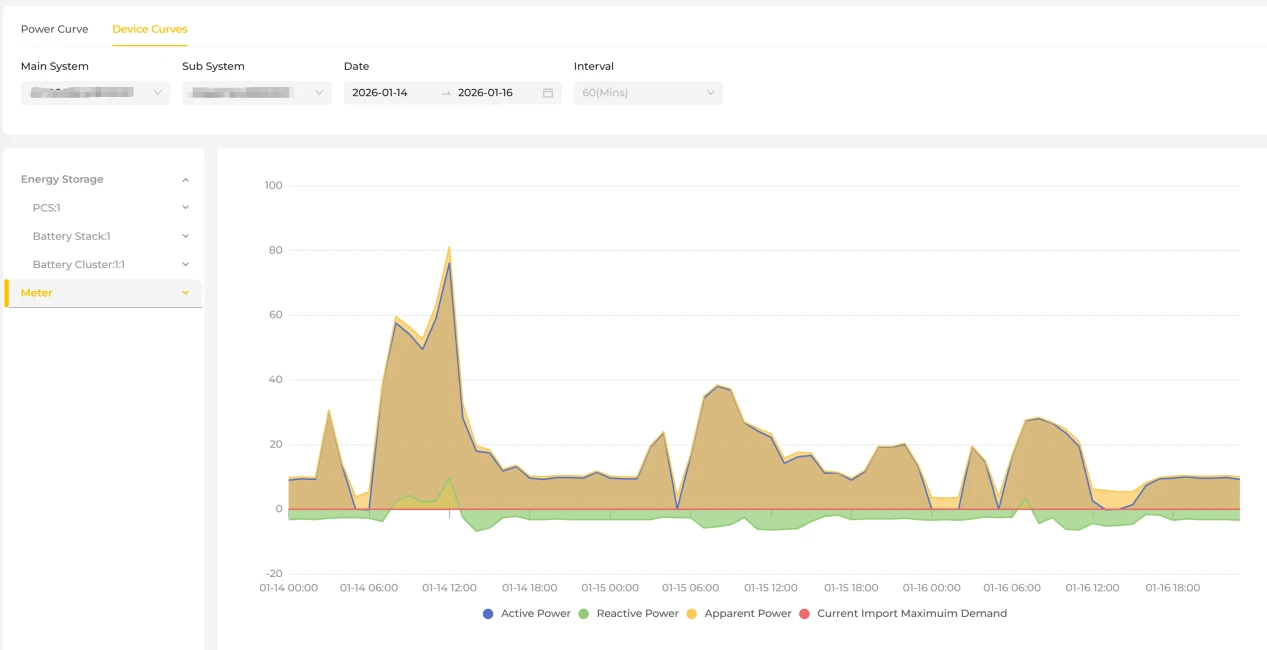
This page is mainly used to display the performance data of the energy storage system over a given period. It lets you view the operating status and power data of the various system components (PCS, battery, meters, PV modules and so on). You can select different "main systems" and "sub-systems" to view.
The date picker lets you set the time range you want to view, up to a maximum span of three days, and view the corresponding data.
The menu bar on the left of the page lists the various device components, such as the PCS, battery and PV equipment. Select a component to view its power and status data for the selected period. The selected device is highlighted in the chart, making comparison and analysis straightforward.
Reports
The Reports page shows the plant's profit report and operating report.
Profit report
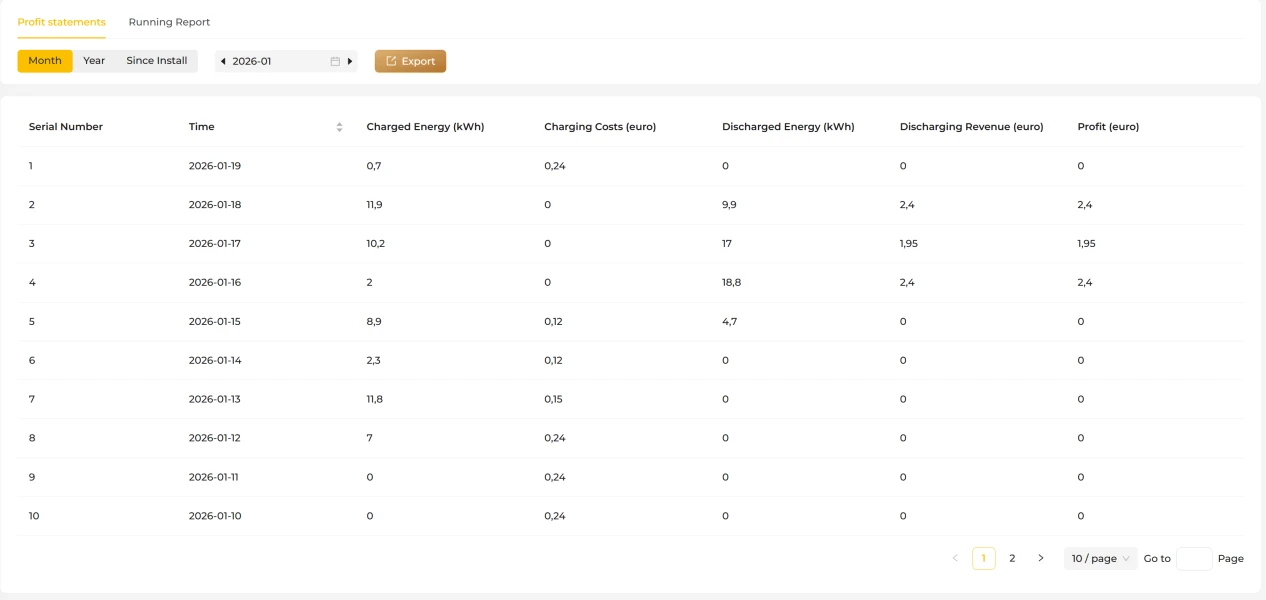
The profit report page shows the plant's profit across different time periods, giving you a clear view of the energy storage system's economic performance.
The page supports three time dimensions — monthly, annual and since installation — and can report the following data: charge energy, charging cost, discharge energy, discharge revenue and profit. By switching between time dimensions you can compare performance across periods, which is useful for operational analysis and cost assessment. The page also supports data export, so you can export the current report for local storage, reconciliation or further analysis.
Operating report
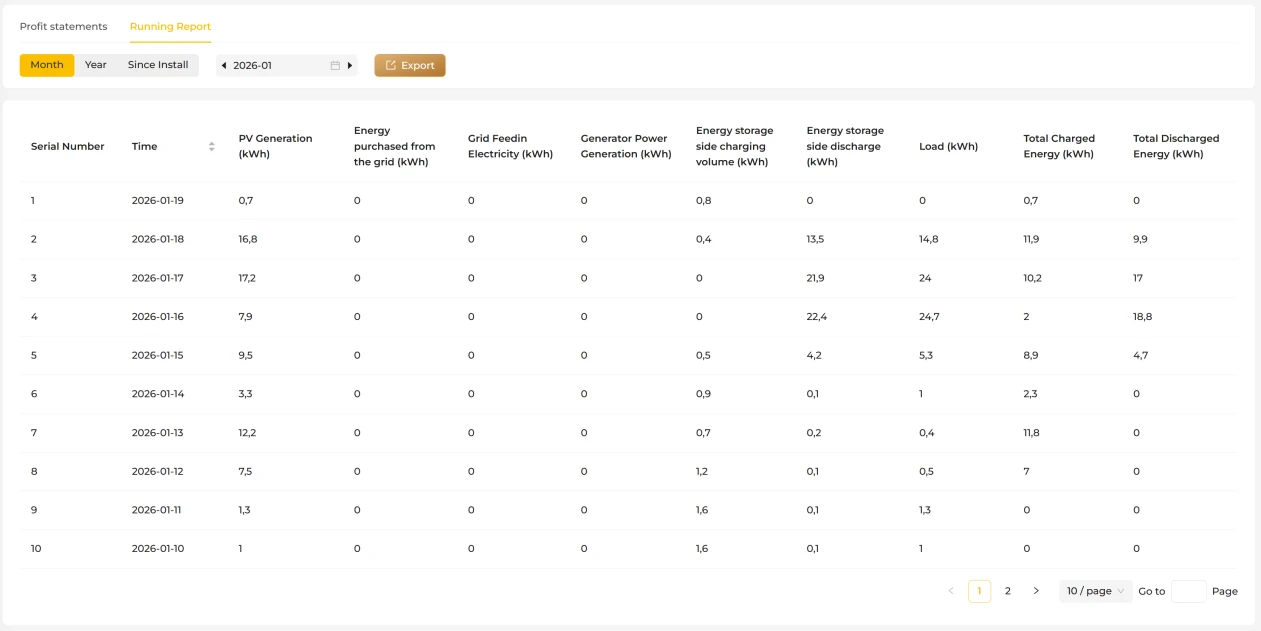
The operating report page shows the plant's operating data over different time ranges, giving you a complete picture of energy use at the plant.
The page supports three time dimensions — monthly, annual and since installation — and can report the following operating data: PV generation, energy purchased from the grid, energy fed into the grid, diesel generator output, storage-side charge energy, storage-side discharge energy, load, total charge energy and total discharge energy.
By switching between time dimensions you can compare operation across periods at a glance, making it easier to analyse the plant's energy mix and operating performance. The page also supports data export, so you can export the current report for local storage, data analysis or reporting purposes.
Faults and Alarms
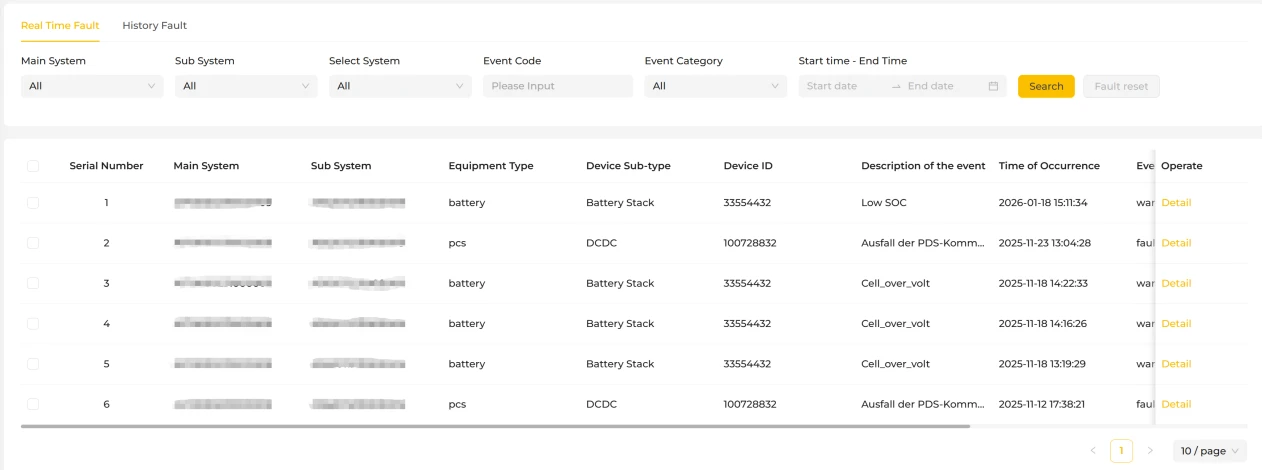
The Faults and Alarms page shows both real-time and historical faults for the current plant.
Real-time faults
The real-time faults page shows the alarms and faults currently occurring at the plant, helping you stay aware of equipment abnormalities and monitor the plant's operating status. A range of filters is provided — main system, sub-system, device, event code, event category and time range — so you can quickly find the fault information you are interested in.
Historical faults
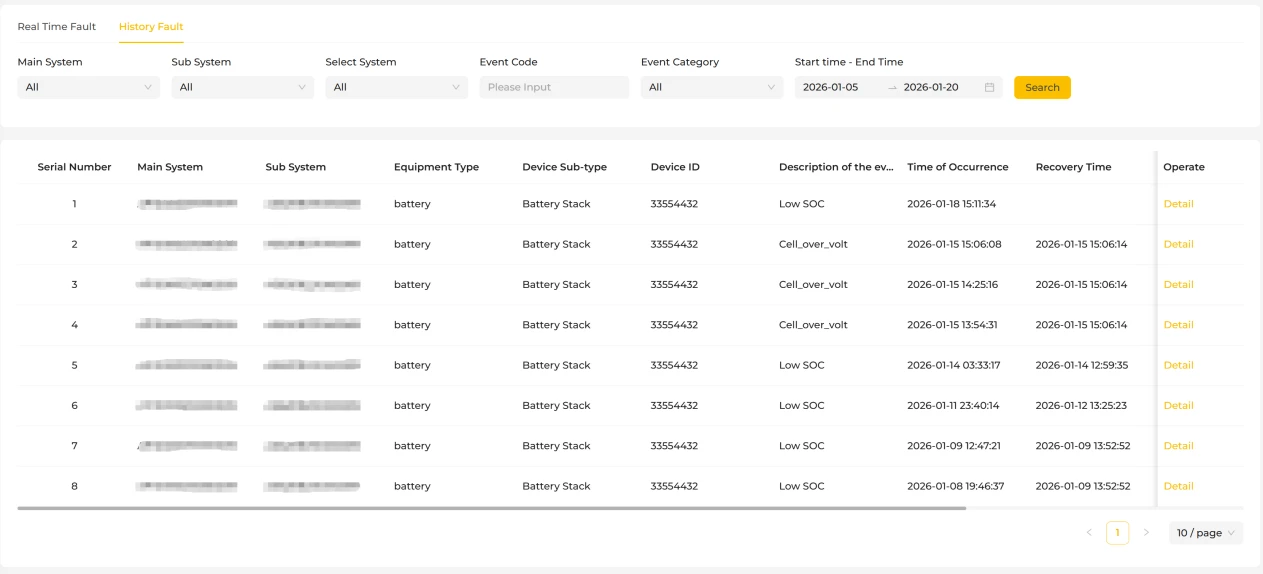
The historical faults page shows the alarm and fault records generated during past plant operation, supporting retrospective analysis and maintenance management.
The page can be filtered by main system, sub-system, device, event code, event category and time range, so you can quickly look up historical faults for a specific period or device and gain a complete understanding of how each fault occurred.